Introduction
Context
Your client is a representative of the Assemblée Permanente des Présidents des Comités de l’eau de Bretagne (APPCB - permanent assembly of presidents of water boards in Brittany), whose remit is to ensure the balanced, collaborative and concerted management of water and aquatic environments in Brittany. It is responsible for:
- Sharing knowledge, tools and information
- Promoting exchanges of experience and the expression of common positions
- Encouraging a territorial organizational system that is relevant to the planning of water management and the increased responsibilities of local water boards (CLEs)
The French Law on Water (Loi sur l’eau) of 1992 triggered the production of water planning and management schemes (Schémas d’Aménagement et de Gestion de l’eau - SAGE) drawn up on the scale of relevant hydrographic areas (river basins). These are the tools of choice for meeting the European requirements for achieving good water status, as defined by the European Water Framework Directive (WFD). For each of these areas, a local water board (Commission Locale de l’Eau - CLE) organizes debates and consultation by bringing together all stakeholders in water issues. The CLE therefore acts as a “local water parliament”, whose main missions are to develop, implement and monitor the progress of work on the SAGE.
Needs analysis
A needs analysis was previously carried out by a senior consultant in your firm. As your team works in agile mode (SCRUM), these needs were expressed in the form of user stories grouped into epics.
Epic no.1
As a member of the permanent assembly of presidents of water boards in Brittany (APPCB), I need to be able to situate the nature (place, quantity, quality) of the groundwater pollution in Brittany on the national scale so that I can evaluate the effectiveness of the policies implemented and then compare the results between regions.
- User story 1A: As a member of the APPCB, I want to see the level of pesticides for each French region and identify the non-compliant water treatment plants so that I can evaluate the effectiveness of the policies implemented and then compare their results between regions.
Epic no.2
As a member of the permanent assembly of presidents of water boards in Brittany (APPCB), I need to be able to identify the current groundwater pollution problems in Brittany in order to allocate the budget for the different water planning and management schemes (Schémas d’Aménagement et de Gestion de l’eau - SAGE) in an effective manner.
Epic no.3
As a policy officer for a water planning and management scheme (SAGE), I need to be able to identify the nature (place, quantity, quality) of the groundwater pollution in the area covered by my SAGE in order to decide which stakeholders (places and activities) to contact, and what type of actions to carry out (one-off or long-term).
Final objective
As part of this activity, we will be focusing solely on user story 1A. You will need to implement the following dashboard model using Tableau Desktop software:
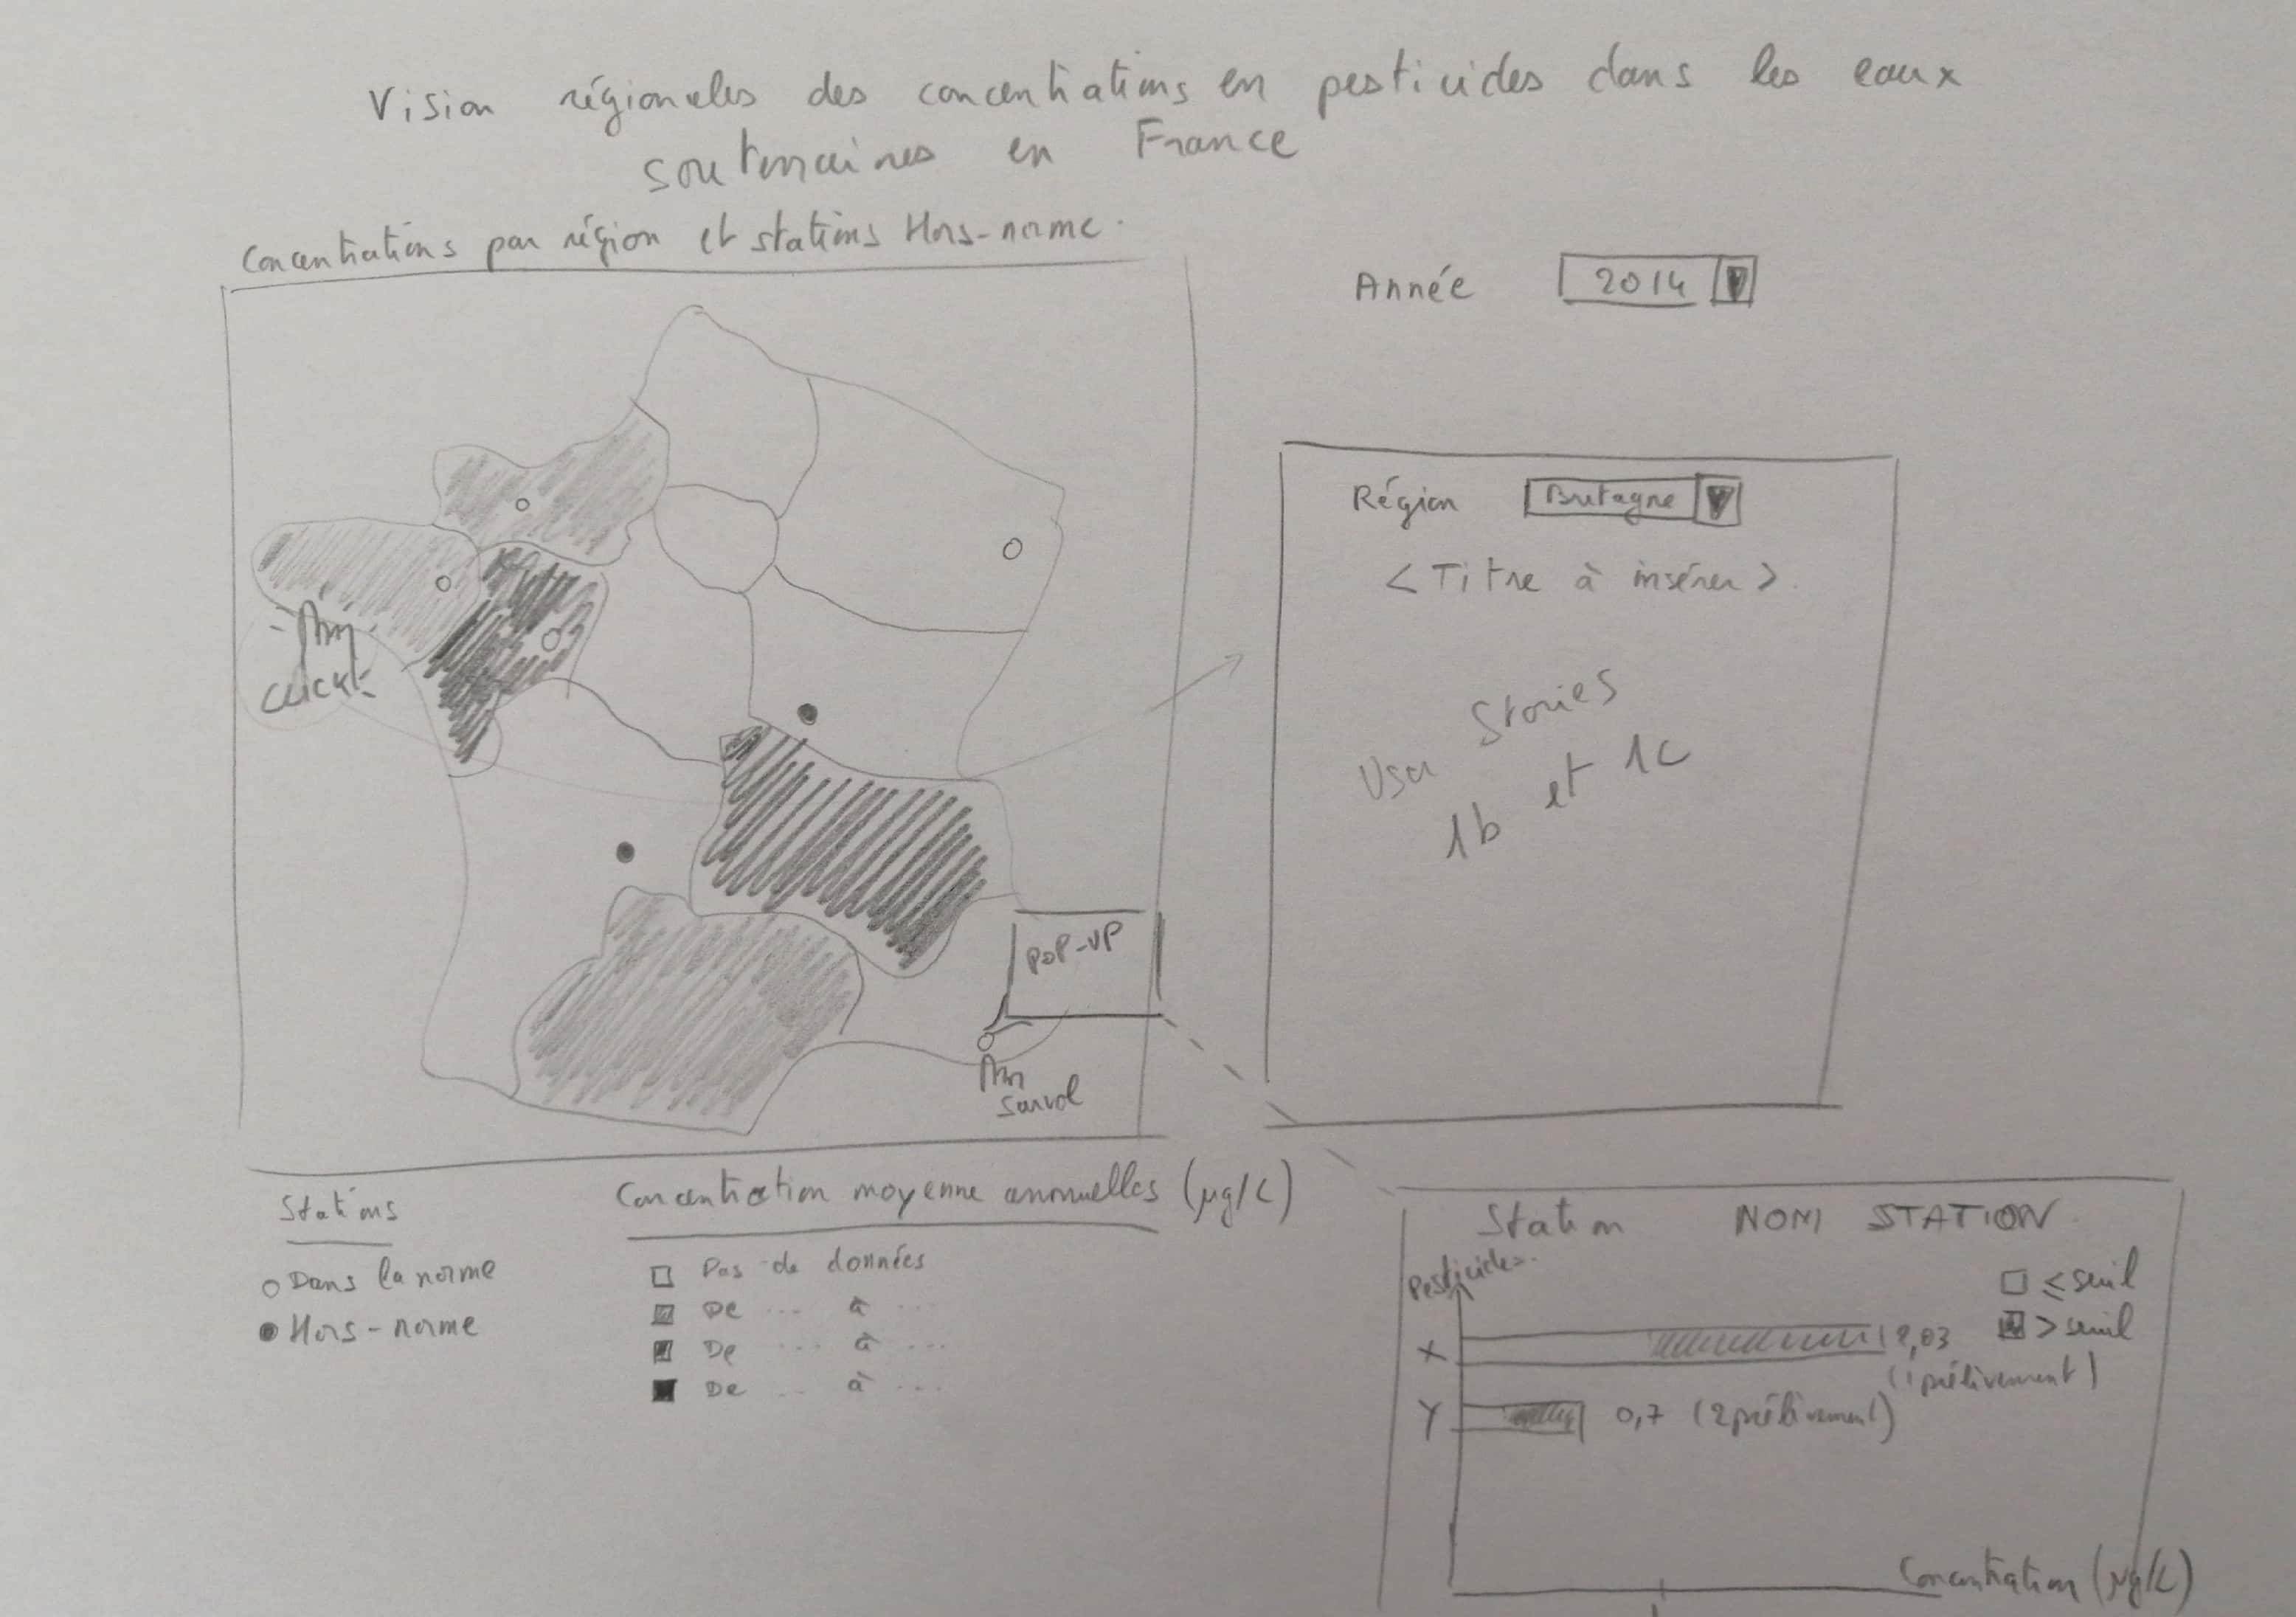
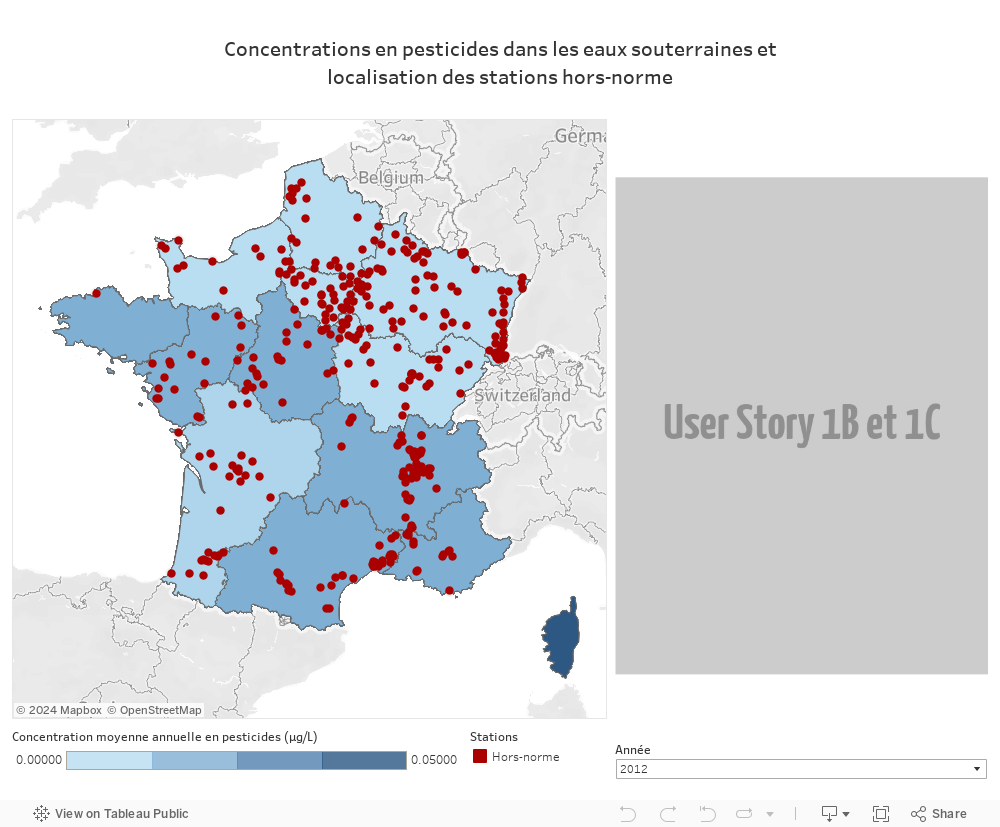
At the end of the activity, you should be able to achieve the following result:
Configuring the environment
Accessing Tableau Desktop
If you would like to use the IMT Atlantique VDI environment:
- [Windows] Follow the instructions on this page
- [Mac] Follow the instructions on this page
- [Linux] Launch the command
sudo apt-get install virt-viewer - Access the [VDI] portal and launch the machine
TP-UE-BI-x - Launch the Tableau Desktop software (username
userpasswordusr)
If you are using your personal workstation:
- Download and install the latest version of Tableau Desktop (Windows or MAC required).
- Download the Pesticides dataset (1.2 Mo).
- Launch the Tableau Desktop program
Importing source data
In Connexion (Log on), choose the option Fichier text (Text file) and select the fact_prelevements.csv file in the source data.
The current screen shows different spaces:
- The connection to be used in the tables to use the event source defined in space no.3.
- The list of available files because they are present in the same directory as the initially imported file.
- The data-structuring space where you will specify the links between files.
- An overview of the data for each of the files, which will be loaded into the memory.
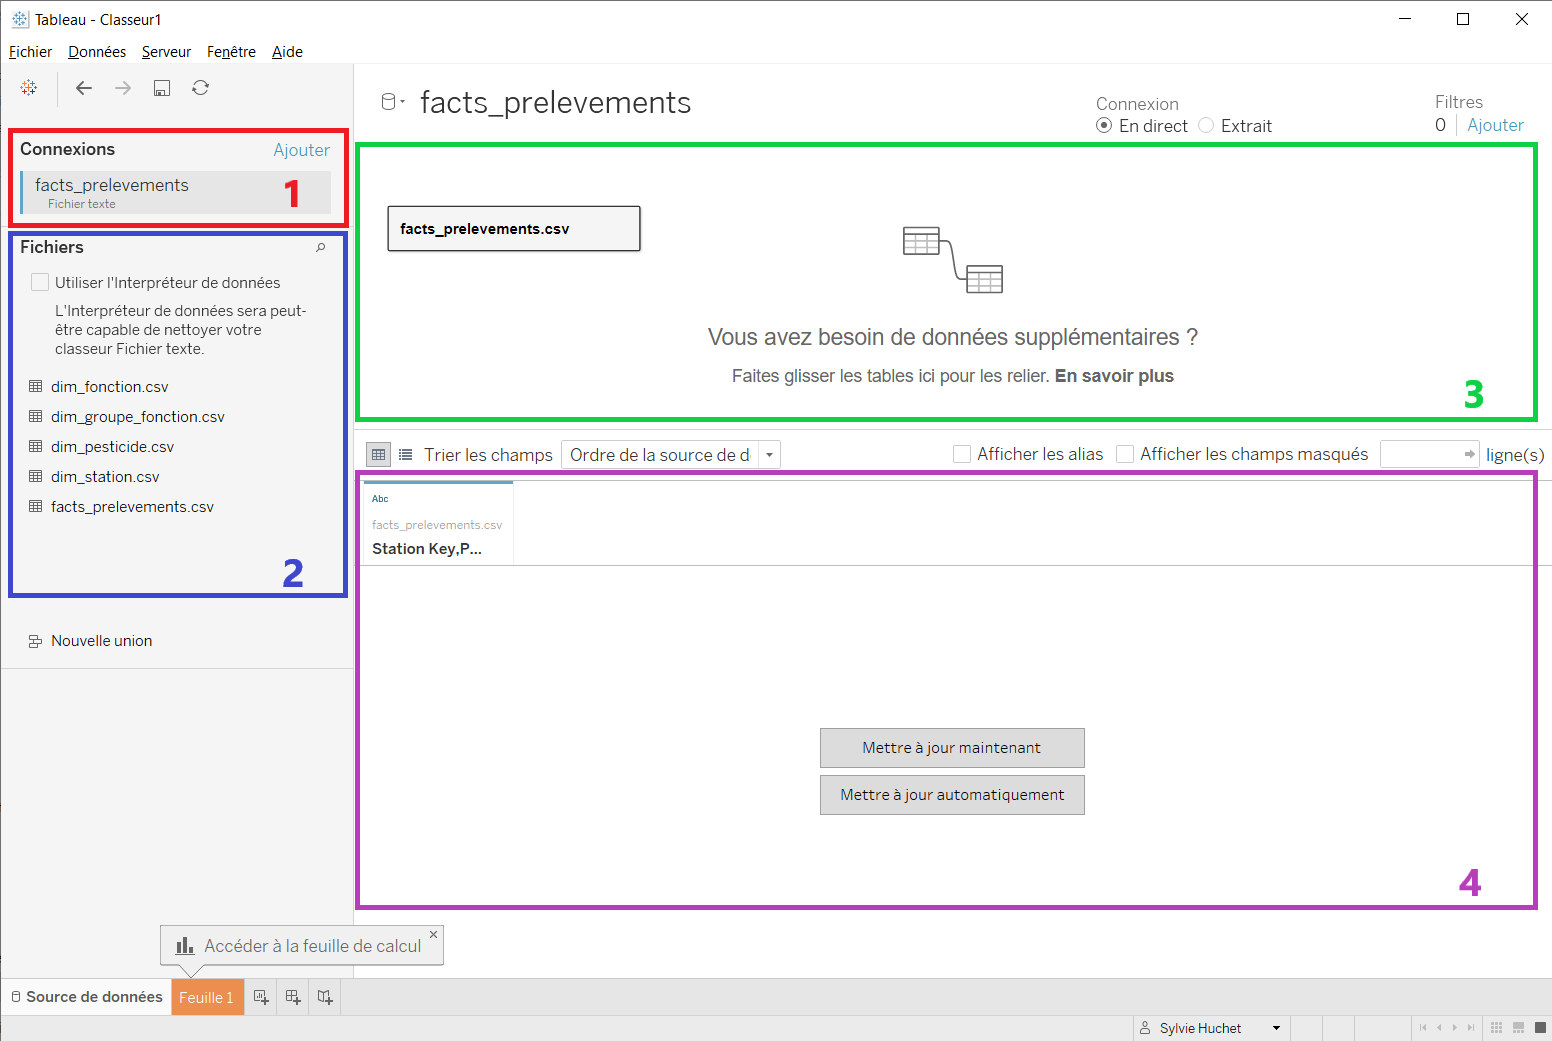
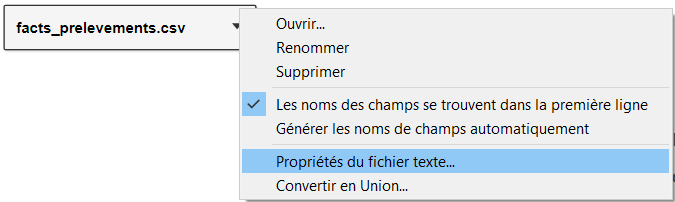
In space no.4, click Mettre à jour maintenant (Update now). The data in the facts_prelevements.csv file are incorrectly displayed because the file format is wrongly detected by default. To remedy this problem, go to space no.3, right-click the facts_prelevements.csv box and choose the Propriétés du fichier texte (Text file properties) option. Place the field separator on Virgule (Comma).
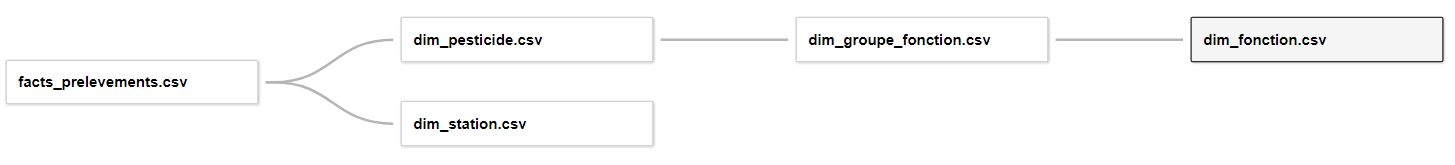
Import the other CSV files from the source and link them in order to obtain the schema below.
To do this, for each of the files to be imported:
- Double-click the file in the list of available files, or drag and drop it into the data-structuring space.
- Close the small
Modifier la relation(Modify the relationship) window which opens automatically. - In
Propriétés du fichier textefor the file (right-click the file name), place the field separator onVirgule. - Click the link that associates it with another file to configure the link.
- In the
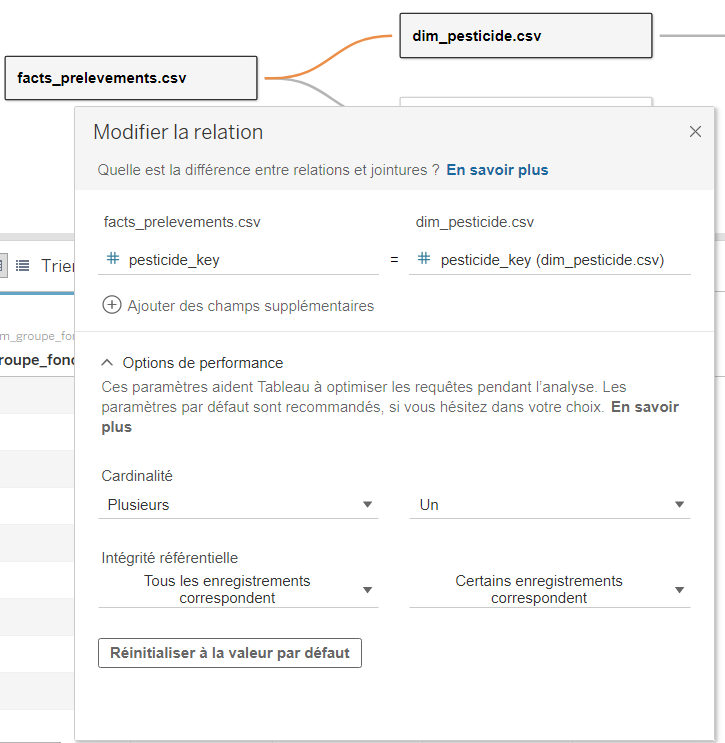
Modifier la relationwindow, select the liaison fields for each of the two files (in our specific case, the fields of both files each have the same name) and configure the performance options as indicated below:- Link between
fact_prelevements.csvanddim_pesticide.csv(see screenshot):- Field: pesticide_key
- Cardinality: Several - one
- Referential integrity: All records match - Certain records match
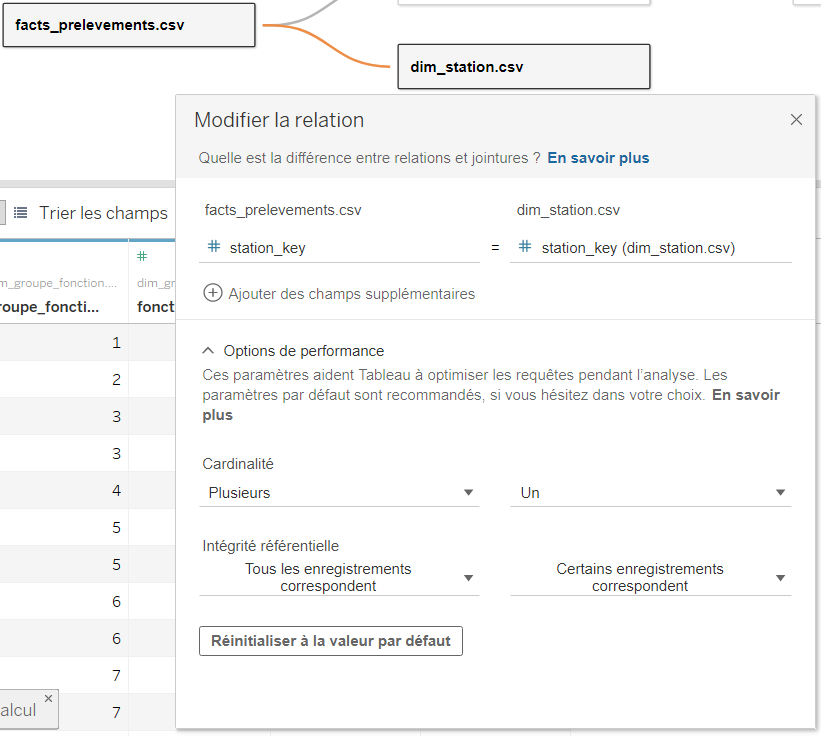
- Link between
fact_prelevements.csvanddim_station.csv(see screenshot):- Field: station_key
- Cardinality: Several - one
- Referential integrity: All records match - Certain records match
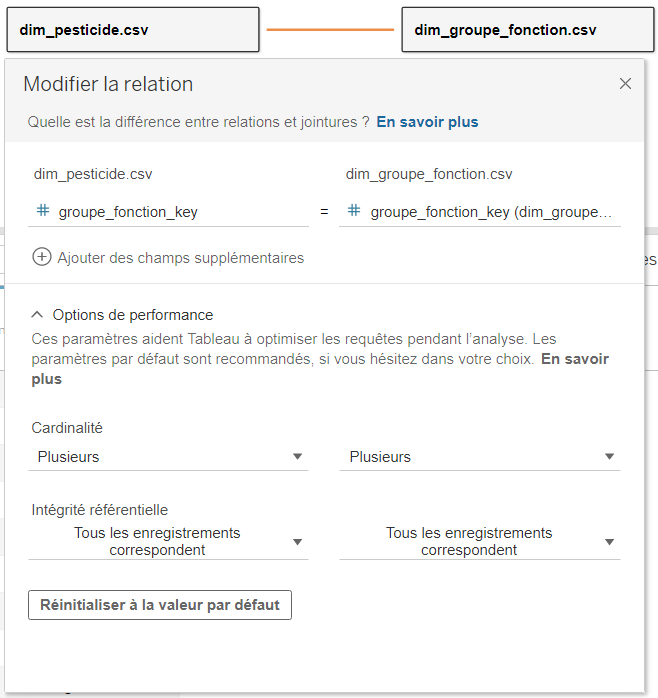
- Link between
dim_pesticide.csvanddim_groupe_fonction.csv(see screenshot):- Field: groupe_fonction_key
- Cardinality: Several - Several
- Referential integrity: All records match - All records match
- Link between
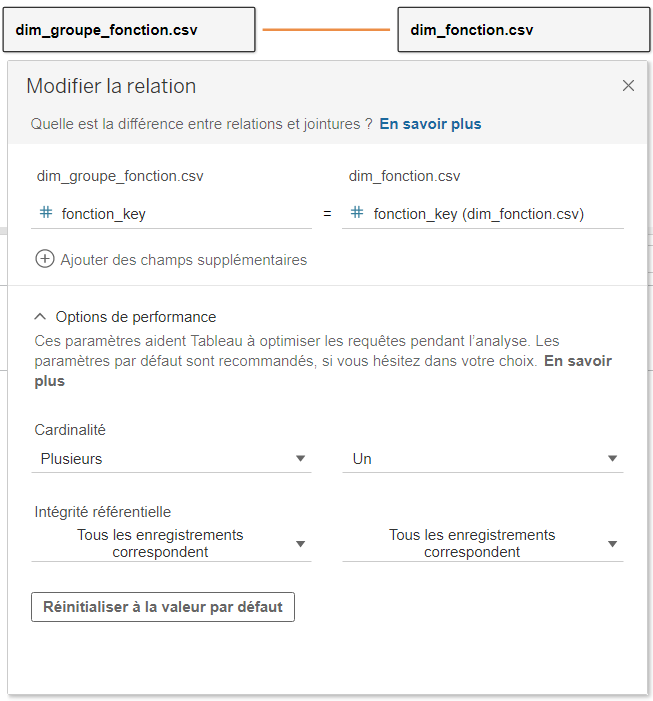
dim_groupe_fonction.csvanddim_fonction.csv(see screenshot):- Field: fonction_key
- Cardinality: Several - One
- Referential integrity: All records match - All records match
- Link between
Once all dimensions have been imported, click Extrait (Extract) on the top right-hand side to force the preloading of data during the first use of the connection.
Creating a horizontal bar chart
Objective
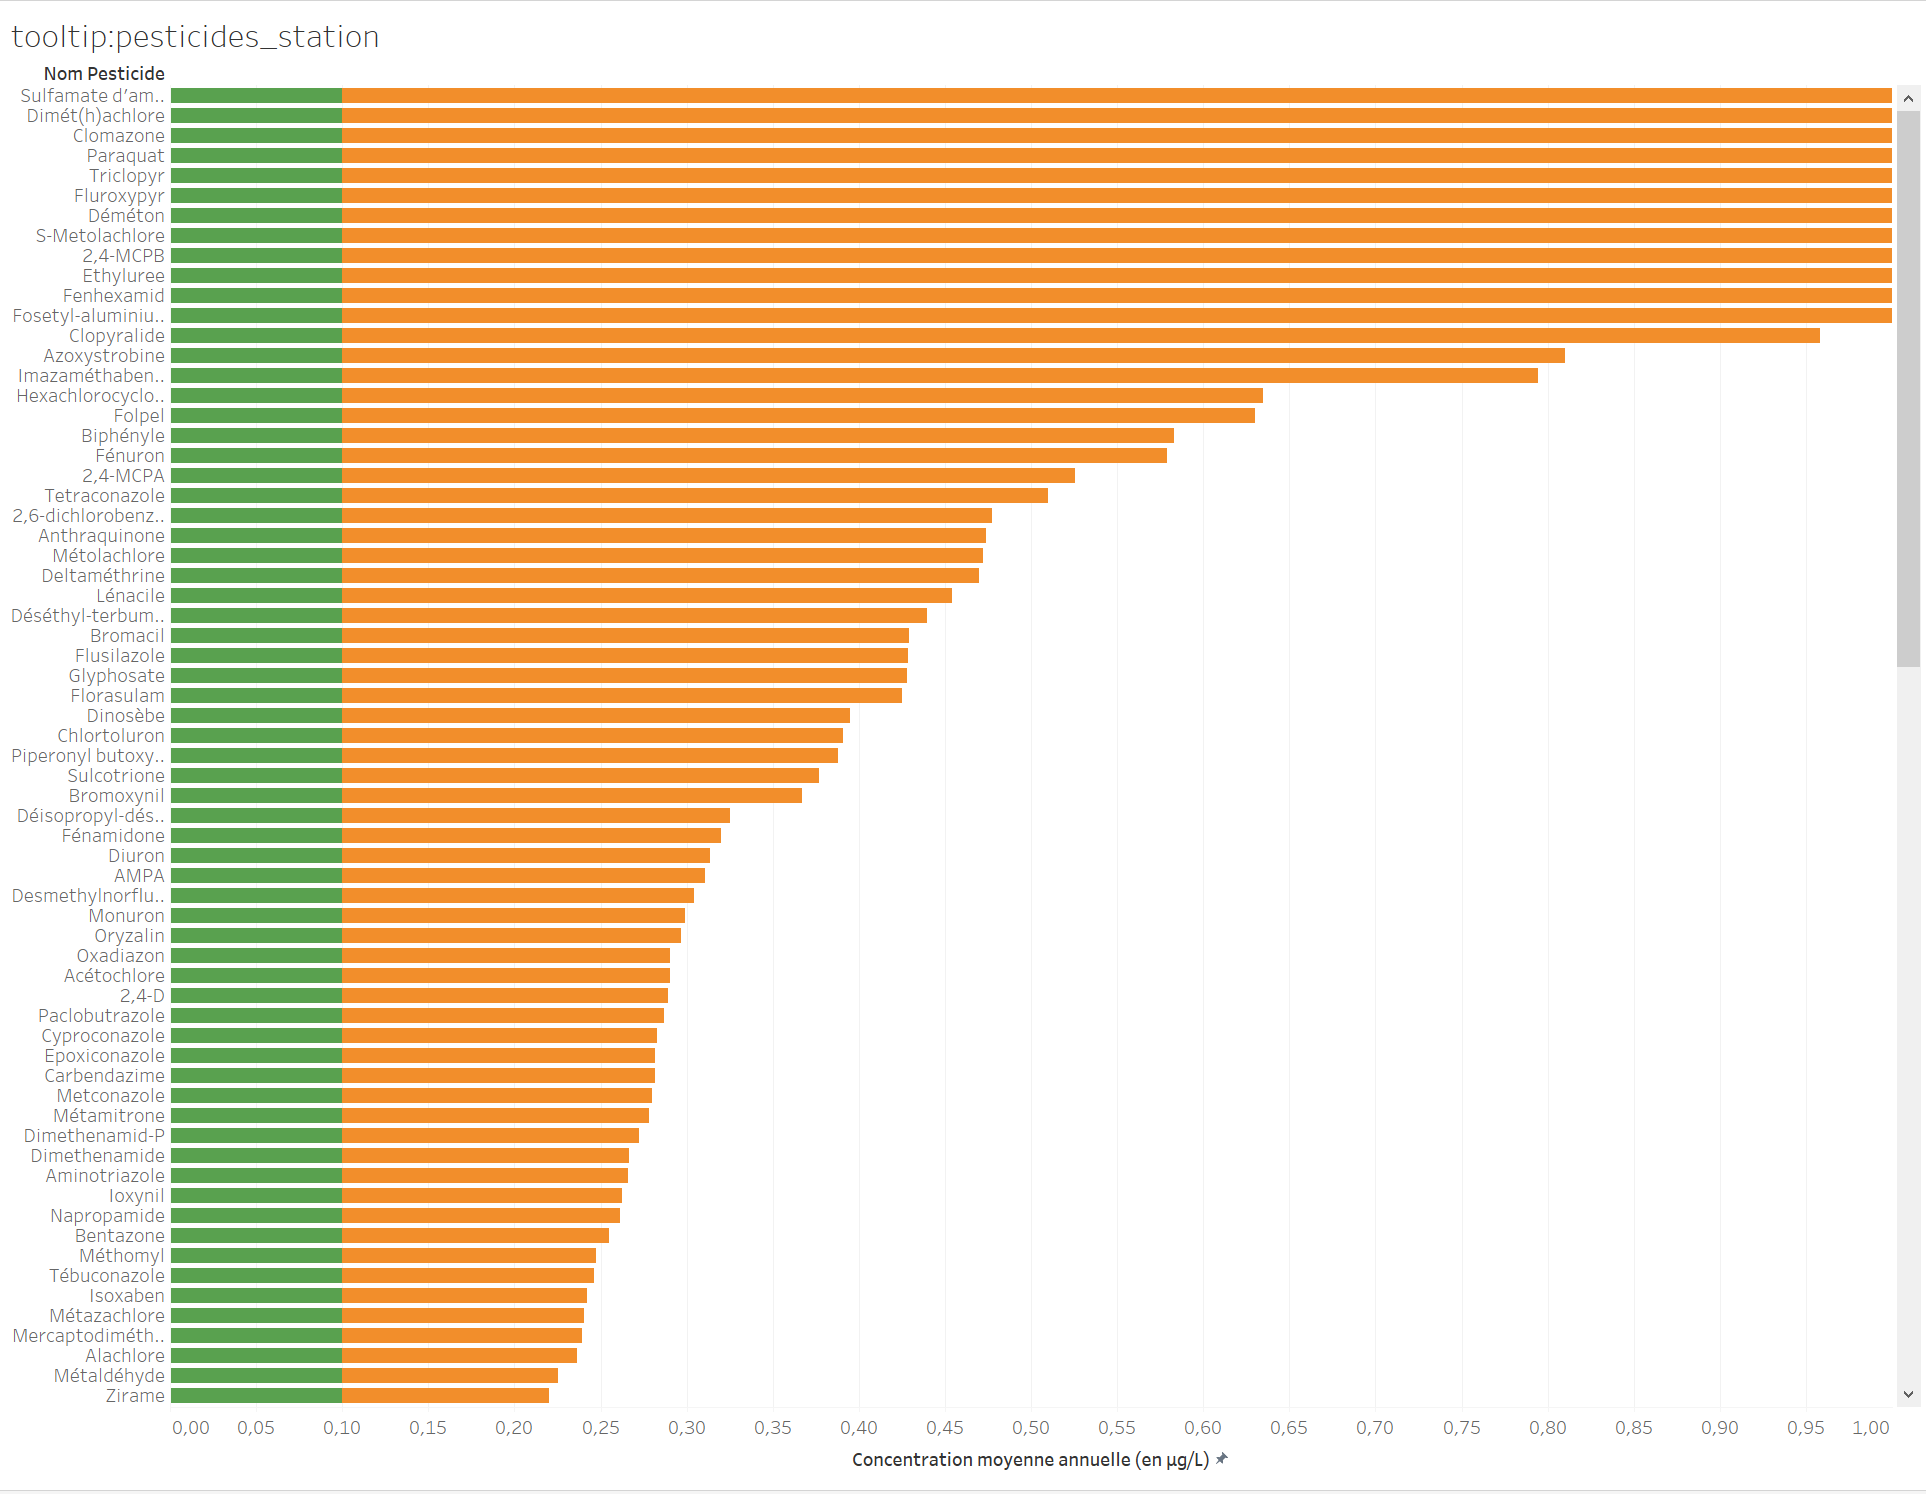
We will be creating a first chart that displays the average concentration in µg/L of pesticides which have been declared non-compliant by distinguishing between the proportion that conforms to the standard and that which exceeds the standard. The aim is to insert this chart subsequently into a tooltip on the interactive map. This will enable the graphic to be customized per year and per water treatment plant when the user mouses over the map.
Procedure
Open this page and follow the step-by-step instructions.
Creation of an interactive map
Objective
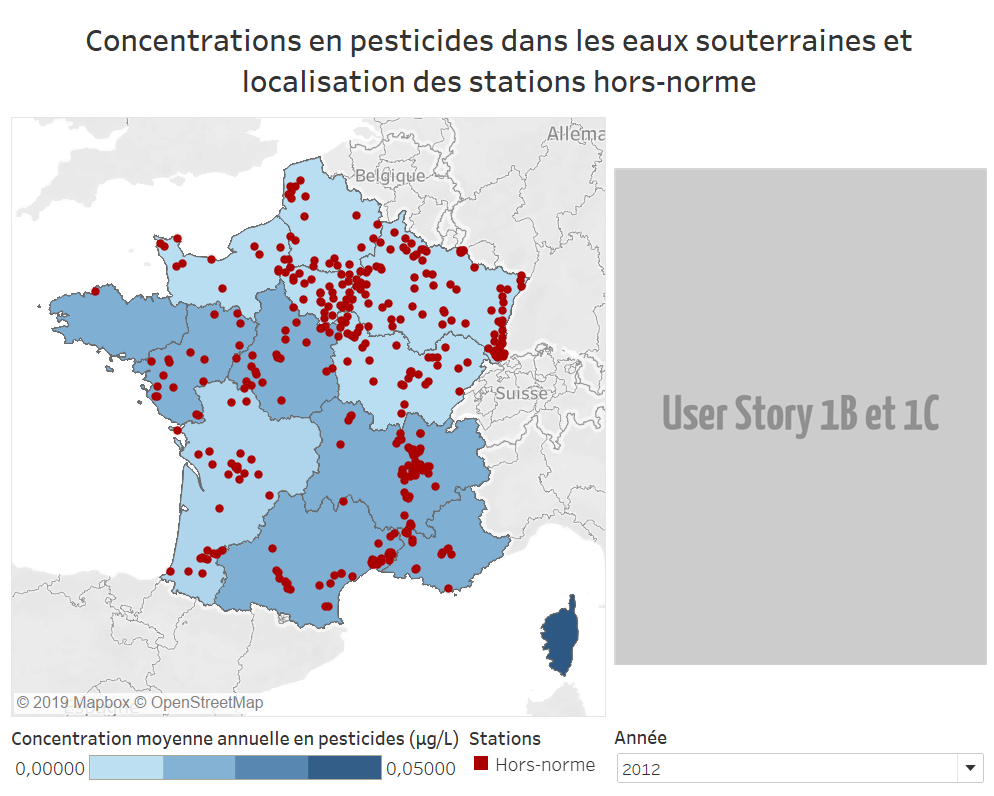
We will now create our map, which has a dual goal: our client wants to see the average pesticide concentration per region for a given year, but also to identify the plants at which a non-compliant sample has been recorded during the year. By mousing over a plant, you can therefore view the non-compliant pesticide levels detected by consulting the chart we produced previously.

Procedure
Open this page and follow the step-by-step instructions.
Assembling indicators in a dashboard
Objective
We will now assemble the different indicators as in the model proposed at the start of the activity. The aim is to obtain the following representation:
Procedure
Open this page and follow the step-by-step instructions.
Publication
We will now publish your work and post it online. The first solution (free), enables you to share your work publicly. The second (for purchase), needs to be used if you want to share confidential data. In this activity, we will be using the public version. If, during one of your projects, your client does not want to provide public access to its data, access codes will need to be provided in order to use its private space.
Open publication on Tableau Public (to be used for this practical session)
Start by creating an account on Tableau Public.
In Tableau Desktop:
- In the
Serveur(Server) menu, chooseTableau Publicfollowed byEnregistrer sur Tableau Public(Save in Tableau Public).
Wait until the data and documents have been exported and then go to your profile page. When the export has been completed, a web page will open:
- Beside the
Détailsmenu, click the icon to modify the details - In the
Titre(Title) field, state: “Pesticide concentration in groundwater and location of non-compliant plants” - In the
Descriptionfield, state:
“Data derived from: https://www.data.gouv.fr/fr/datasets/pesticides-dans-les-eaux-souterraines/ Dashboard used during a training program: http://formations.imt-atlantique.fr/bi/bi_atelier_tableau_desktop.html”
Restricted publication on Tableau Server (for information)
Find the invitation to join Tableau Server in your emails and log in:
- In the
Serveurmenu, choosePublier un classeur(Publish a spreadsheet) and then click theTableau Onlinelink on the bottom left-hand side of the screen. - Enter your identifiers.
When the following window opens, you must state where you want to save your project:
- In the
Projet(Project) field, choose the dedicated space assigned to your group, where you have write rights. - Complete the different fields, including the description.
- Click
Publier(Publish)