Spotlight on the layout of several indicators culminating in the creation of a dashboard for online publication.
Tableau data visualization software is provided by the Tableau for Teaching program. Ask your teacher for a key.
Objective
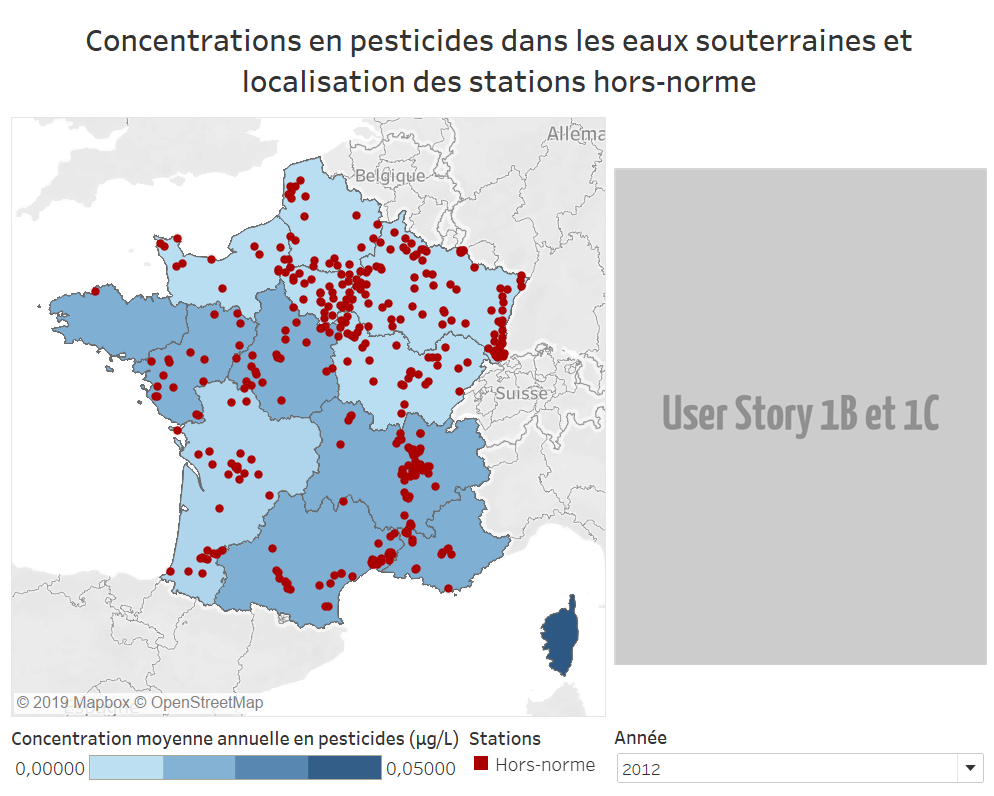
We shall now assemble the different indicators as shown in the model proposed at the start of this activity. The aim is to obtain the following representation:
Procedure
Initializing the dashboard
We shall now create a new dashboard:
- Choose the “New dashboard” option to create a new sheet,and name it “Pesticides in France”.
- In the
Feuillesspace, double-clickCarte régionale: this will give the default settings for our map, filters and keys.
Altering the layout
In order to reposition the keys underneath the map, you must create a space beneath it.
- Move a
Horizontalobject from theObjetsspace and position it as shown in the image below.
- Drop the concentration key into the new space on the left-hand side.
- Drop the plant key into the new space on the right-hand side.
- Drop the year key into the new space on the right-hand side.
- Double-click the pesticide key and rename it:
Concentration moyenne annuelle en pesticides (µg/L)(Annual average pesticide concentration).
Finishing touches
We would prefer a general title rather than a title just above the map:
- Open the map options (click the map to open a menu above it on the right hand side); choose the arrow and then uncheck the
Titreoption - From the
Objetspace, drag and drop a text field so that it completely covers the top of the table, and enter the title “Pesticide concentrations in groundwater and location of noncompliant plants”
To finish, we need to insert a fake image to reserve the space earmarked for the future user stories:
- From the
Objetspace, drag and drop an image field and position it on the right-hand side of the map above theAnnéefilter. - Import the image and choose to adjust it.
- Adjust the dimensions of the different keys to ensure that all elements are clearly legible.