Objective
This page aims to describe step by step the process of importing data into Power BI from a csv format structured as a dimensional schema (including at least one fact table and its dimensions). This step occurs at the end of the Extraction - Transformation - Loading (ETL) phase to correctly import various data types and configure the dimensional schema in Power BI.
This activity is part of the Power BI practical session (Power BI) but can be carried out independently.
Configuring Your Power BI Project
Make sure to perform the following configuration actions before starting:
- Set English as the regional settings language:
File>Options and settings>Options - In the
Globalsection:- Subsection
Regional Settings:Application language>English (United States)(to have your client in English and follow this tutorial).Model Language>Use application language(to enable string comparison and internal date field creation).DAX Separators>(Recommended) Use Standard DAX separators(for handling separators in DAX queries).
- Subsection
Security:Map and Filled Map visuals> checkUse Map and Filled Map visuals(to enable drawing maps).
- Subsection
- In the
Current Filesection:Regional Settings>Locale for import>English (United States)(because, in our context, data is encoded with,as the field separator and.as the decimal separator).
Back on the main screen, if a yellow banner appears, click Apply changes. You might also be asked to restart your client.
Importing Source Data
Start by downloading the Pesticides dataset (1.2 MB).
Launch PowerBI. If the home screen (yellow and black background) appears, close it. To import the data, you’ll need to select Get Data > Text/CSV > Connect each time you’re prompted to import a file.
We will import a fact table, 3 dimension tables, and a gateway table. Some tables will require modification of import parameters, especially when field types are not recognized.
Note: For each import step, it’s essential to select the appropriate file, define the data type detection method, and apply transformations if necessary. These steps ensure correct data importation into Power BI.
Fact Table (facts_prelevements.csv)
The fact table contains the main measurements we want to analyze. Using Data Type Detection based on the first 200 rows is sufficient because the file is large. However, the average concentration exceeding the norm is poorly detected. We need to manually adjust by changing the data type of the concentration_moyenne_sup_norme column from Whole number to Decimal Number.
- Choose the file
facts_prelevements.csv. - Leave the
Data Type Detectionparameter atBased on first 200 rowssince the file is very large. - Click
Transform Databecause Power BI poorly detects theconcentration_moyenne_sup_normefield, which is always zero for the first 200 rows.- In the new Power Query Editor window, select the
concentration_moyenne_sup_normecolumn and in theTransformtab, change itsData TypefromWhole numbertoDecimal Number. Choose to replace the current column type.- To confirm, select the
Hometab >Close & Apply.
- To confirm, select the
- In the new Power Query Editor window, select the
Station Dimension (dim_station.csv)
The station dimension represents information about sampling stations. Since the file is not large, we use Data Type Detection based on the entire dataset. No transformation is needed here, so we can load the data directly.
- Choose the file
dim_station.csv. - Set the
Data Type Detectionparameter toBased on entire datasetsince the file is not large. - Click
Loadto load the data.
Pesticides Dimension (dim_pesticide.csv)
In the pesticides dimension, the file requires type detection based on the entire dataset. Additionally, the date_retrait column is poorly detected, so we transform it into the Date data type.
- Choose the file
dim_pesticide.csv. - Set the
Data Type Detectionparameter toBased on entire datasetsince the file is not large. - Click
Transform Databecause Power BI poorly detects the data type of thedate_retraitfield. - In the new Power Query Editor window, select the
date_retraitcolumn, and in theTransformtab, chooseDateas the data type. Choose to replace the current column type. - To confirm, select the
Hometab >Close & Apply.
Gateway Table (dim_groupe_fonction.csv)
The gateway table, which links pesticides to their functional groups, is loaded directly without requiring transformation.
- Import
dim_groupe_fonction.csvand clickLoad.
Function Dimension (dim_fonction.csv`)
The function dimension is also loaded without requiring transformation.
- Import
dim_fonction.csvand clickLoad.
Configuring Aggregation Properties
In the fact table (facts_prelevements), we need to configure aggregation properties to ensure proper use in visualizations. Attributes such as station_key and pesticide_key should not be aggregated (Don't summarize) as they are keys to dimensions. Degenerate dimensions like respect_norme and annee should not be aggregated either.
On the other hand, measures such as norme_dce_prelevement, concentration_moyenne, concentration_moyenne_inf_norme, and concentration_moyenne_sup_norme should be aggregated as averages because they are non-additive facts.
Power BI cannot know the aggregation properties of facts in your fact table, so we need to check and potentially correct its suggestions. In the Data screen, select the facts_prelevements fact table.
Configure the aggregation properties of the following attributes by modifying the Summarization field value:
station_keyandpesticide_key: these are keys to dimensions, and the property should already beDon't summarize.respect_normeandannee: these are degenerate dimensions, selectDon't summarize.norme_dce_prelevement,concentration_moyenne,concentration_moyenne_inf_norme, andconcentration_moyenne_sup_norme: these are non-additive facts, selectAverage.
In the Model screen, you may see aggregated attributes (sigma symbol) in dimensions, which is not appropriate. Here is a non-exhaustive list: groupe_fonction_key, code_sandre, norme_dce. If this symbol appears, you can make modifications from the Model screen:
- Select the field by clicking on it.
- In the
Propertiestab on the right side of your screen, click at the bottom onAdvanced. - Change the value of the
Summarize byfield and chooseNone(equivalent to theDon't summarizeoption found in theDatascreen; the interface is not consistent).
Configuring Table Relationships
Power BI does not automatically create a relationship between the dim_pesticides and dim_groupe_fonction tables. We need to manually create this relationship by linking the groupe_fonction_key attribute from the dim_pesticide dimension to that of the dim_groupe_fonction dimension. It’s important to configure Cross filter direction to Single (dim_groupe_fonction filters dim_pesticides) to ensure proper filtering.
This manual relationship ensures consistency in the dimensional schema.
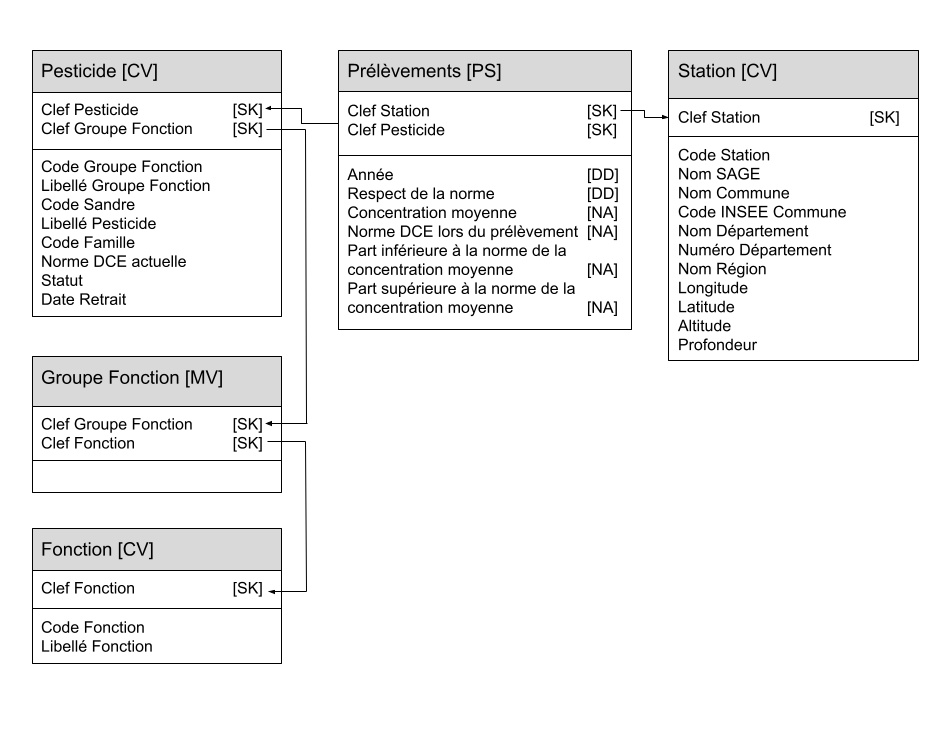
The data schema containing all imported tables can be seen in the 3rd Model screen. As Power BI couldn’t create the link between the dim_pesticides and dim_groupe_fonction tables, you will do it manually:
- Create a relationship by selecting the
groupe_fonction_keyattribute from thedim_pesticidedimension to that of thedim_groupe_fonctiondimension. - Configure
Cross filter directiontoSingle (dim_groupe_fonction filters dim_pesticides)
Now your data schema should look like the image below. In a future activity, we will learn how to read and design this type of data schema.
Configuring Geographical Data
Correction on Region Names
Power BI has trouble recognizing certain regions if the syntax is not in the form FR,region_name. To avoid this problem, we will create a new column in the dim_station table where regions will have the necessary syntax. We will apply this modification in the table definition by modifying the import query.
For this, in the Report screen, right-click on the dim_station table and choose Edit query:
- Duplicate the
nom_regioncolumn: right-click and thenDuplicate column. - Rename the duplicated column to
libelle_nom_region. - Now select the
nom_regioncolumn:- In the ribbon, go to the
Transformtab, click theFormatbutton (ABC icon with a pencil), and selectAdd Prefix. - In the displayed window, type
FR,in theValuefield.
- In the ribbon, go to the
- Confirm the modification:
File>Apply & Close.
Categorizing Data
To ensure that the region name is considered as a region by the software (automatically creating areas on maps), it’s necessary to define a geographical category for this attribute. Still in the Data screen, select the nom_region attribute in the dim_station table. In the Column tools menu, choose State or Province for the Data category property.
Do the same with the nom_commune attribute by selecting the City category, and with the longitude and latitude attributes by assigning them the corresponding category.