Introduction
Context
Your client is a representative of the Assemblée Permanente des Présidents des Comités de l’eau de Bretagne - permanent assembly of presidents of water boards in Brittany (APPCB) whose remit is to ensure the balanced, collaborative and concerted management of water and aquatic environments in Brittany. It is responsible for:
- Sharing knowledge, tools and information
- Promoting exchanges of experience and the expression of common positions
- Encouraging a territorial organizational system that is relevant to the planning of water management and the increased responsibilities of local water boards (CLEs)
The French Law on Water (Loi sur l’eau) of 1992 triggered the production of water planning and management schemes (Schémas d’Aménagement et de Gestion de l’eau - SAGE) drawn up on the scale of relevant hydrographic areas (river basins). These are the tools of choice for meeting the European requirements for achieving good water status, as defined by the European Water Framework Directive (WFD). For each of these areas, a local water board (Commission Locale de l’Eau - CLE) organizes debates and consultation by bringing together all stakeholders in water issues. The CLE therefore acts as a “local water parliament”, whose main missions are to develop, implement and monitor the progress of work on the SAGE.
Needs analysis
A needs analysis was previously carried out by a senior consultant in your firm. As your team works in agile mode (SCRUM), these needs were expressed in the form of user stories grouped into epics.
Epic no.1
As a member of the permanent assembly of presidents of water boards in Brittany (APPCB), I need to be able to situate the nature (place, quantity, quality) of the groundwater pollution in Brittany on the national scale so that I can evaluate the effectiveness of the policies implemented and then compare the results between regions.
-
User story 1: As a member of the APPCB, I want to see, for a given year, the average pesticide concentration for each French region per family, per function and per pesticide so that I can evaluate the effectiveness of the policies implemented and then compare their results between regions.
-
User story 2: As a member of the APPCB, I want to identify, for a given year, the water treatment plants that have recorded at least one non-compliant sample so that I can evaluate the effectiveness of the policies implemented and then compare their results between regions.
Epic no.2
As a member of the APPCB, I need to identify the current groundwater pollution problems in Brittany in order to allocate the budget in an effective manner.
-
User story 3: As a member of the APPCB, I want to see, for a given year in my region, the pesticide levels per family and per function for each of the water treatment plants in order to identify the local practices that need to be addressed.
-
User story 4: As a member of the APPCB, I need to identify, for a given year in my region, the water treatment plants that have recorded at least one non-compliant sample so that I can quickly identify the sites on which priority measures need to be implemented.
-
User story 5: As a member of the APPCB, I want to observe, in my region, the yearly changes in average pesticide concentrations and in the number of non-compliant samples per pesticide family and function in order to determine the degree of urgency (occasional or recurrent situation) and the type of actions (emergency or substantive responses) to be carried out.
Configuring the environment
Downloading Power BI
All information provided in this tutorial as guidance for the menus concerns the English-language version of Power BI. We advise against downloading any other version in a different language.
- Download and install the latest version of Power BI (Windows).
- Open the Power BI software.
Several alternatives are available for Mac owners:
- Install Windows with Bootcamp for owners of Intel-processor-equipped Macs. Read the Apple documentation.
- Access the VDI portal and choose to launch the
TP-UE-BI-xmachine.- Start Windows (login
admin/ mdpadm)
- Start Windows (login
- Install a virtual Windows machine with Vmware (M1 incompatible) or Parallels (additional purchase). Read the documentation.
- Borrow a Windows machine from the DISI.
Configuring Power BI
After installing Power BI, you will need to configure the software before making a start:
- Choose English in the Regional Settings:
File>Options and settings>Options - Under the
Globalheading:Regional Settingssub-heading:Application language>English (United States)(to ensure that you client is in English and to be able to follow this tutorial).Model Language>Use application language(to enable the comparison of strings and the creation of fields internally).DAX Separators>(Recommended) Use Standard DAX separators(for the management of separators in DAX queries).
Securitysub-heading:Map and Filled Map visuals> checkUse Map and Filled Map visuals(to enable mapping).
- Under the
Current Fileheading:Regional Settings>Locale for import>English (United States)(because in our context, our data is encoded with,for field separators and.for decimal separators).
Go back to the main screen. If a yellow banner appears, click Apply changes. You may also be instructed to restart your client.
Importing data
In order to understand the different data importation and configuration steps, you will need to learn some basic dimensional modeling principles. As you have not yet done so, we have provided you with a pre-configured Power BI template and the associated Pesticides (1.2 MB) data set.
- Open the
Atelier_PowerBI.pbittemplate file that you have previously downloaded. At this stage error messages may appear, this is normal! - Go to
File>Options and settings>Data source settings, and for each of the files, enter the correct path to the file on your hard drive. Do not change any settings. - If a yellow banner appears, click
Apply changes. - Save your PowerBI project:
File>Save asand choose a name such asAtelier_PowerBI.pbix(note that the extension has changed; it MUST be.pbix).
Discovering the work space
Your work space consists of three screens (see screenshot below):
Report View(A) for creating your dashboards. Each sheet on this page corresponds to a dashboard (see horizontal bar at the bottom of the screen).Table View(B) for the precise configuration of tables.Model View(C) for specifying the relationships between tables and quickly correcting certain properties (Properties menu on the left).
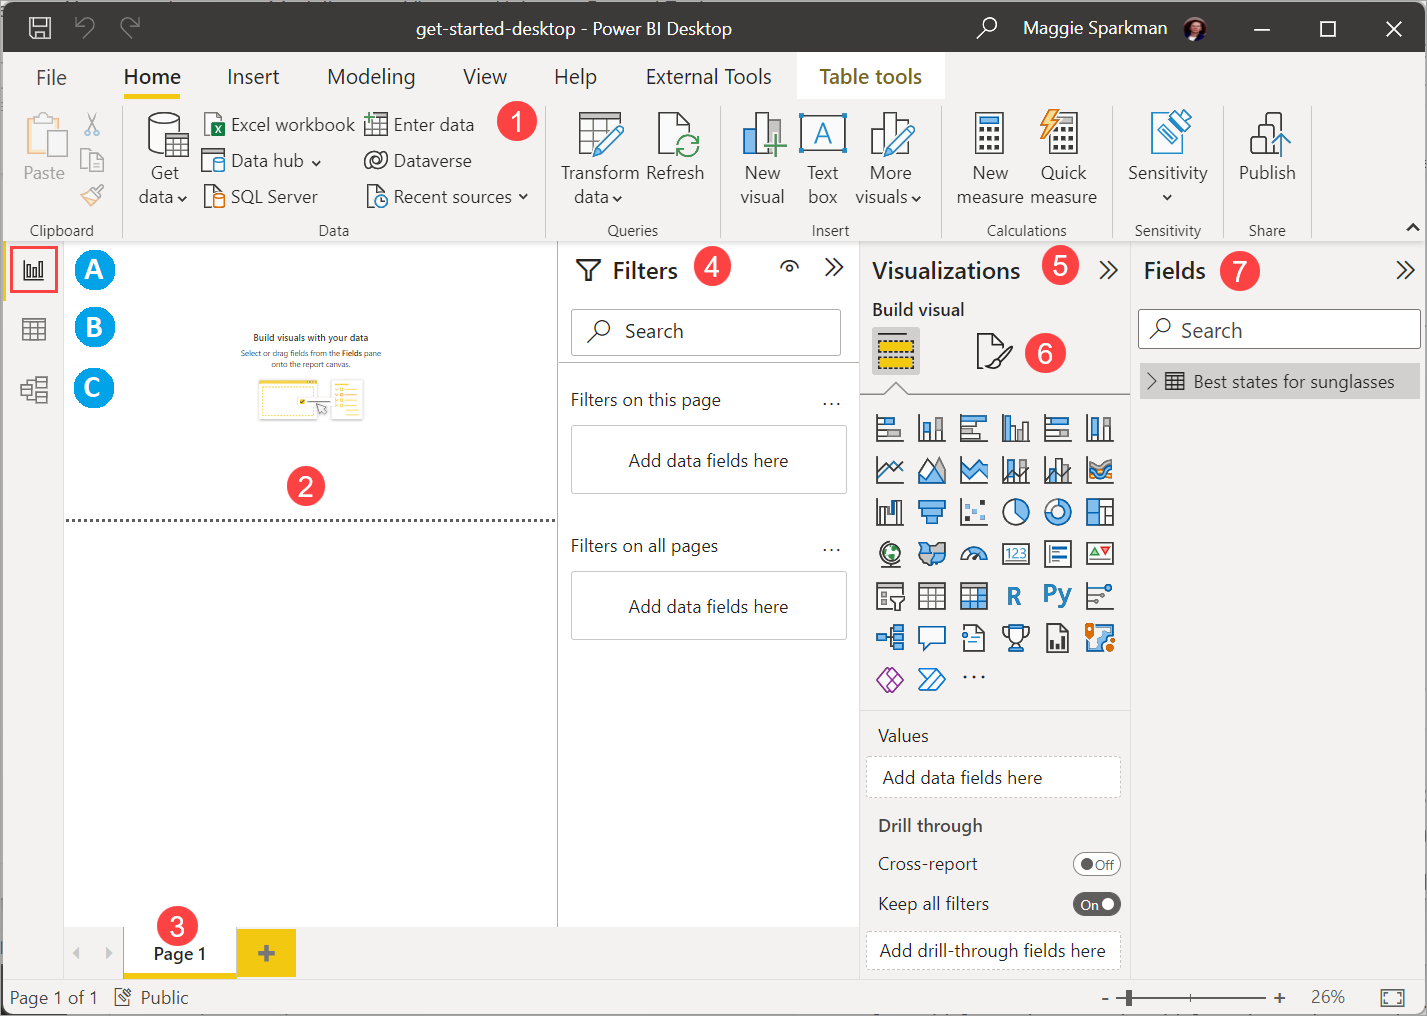
In the Report view in Power BI Desktop, you can generate visualizations and reports. The Report view comprises six main zones (text taken from the official documentation):
- The ribbon, in the upper part, which displays the current tasks associated with the reports and visualizations.
- The canvas zone in the middle, in which you can create and organize visualizations.
- The tab zone, in the lower part, which enables you to select or add report pages.
- The
Filterspane in which you can filter the data visualizations. - The
Visualizationspane in which you can add, modify or personalize visualizations and apply an extraction. - The
Formatpane in which you design the report and the visualizations. - The
FieldsorDatapane (according your PowerBI version), which displays the available fields in your queries. To create or modify visualizations, you can drag these fields onto the canvas, or into the Filters pane or the Visualizations pane.
Official documentation Get started with Power BI Desktop: Build reports
Official documentation Work with Report view in Power BI Desktop: Create reports
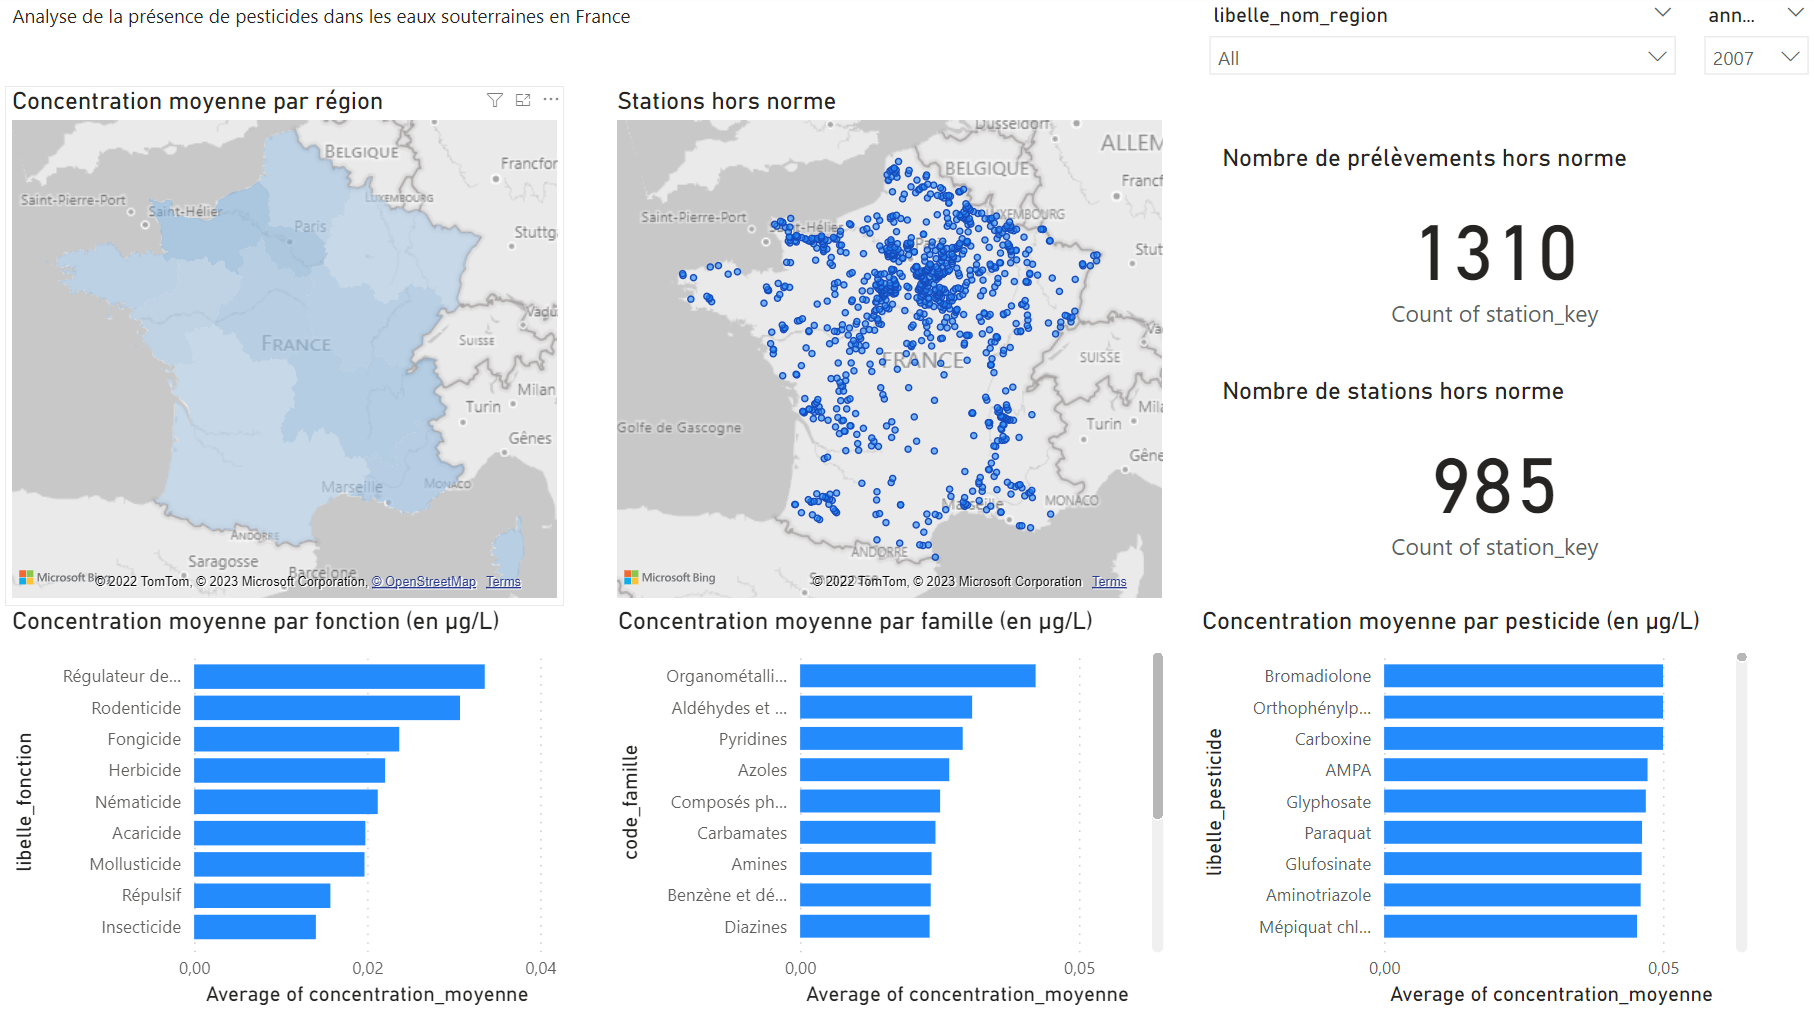
Creating the national dashboard
The aim of this first dashboard is to give users an overview of the situation at the national level, which will enable them to compare their own region with the others. We will therefore be addressing the following two user stories:
-
User story 1: As a member of the permanent assembly of presidents of water boards in Brittany (APPCB), I want to see, for a given year, the average pesticide concentration for each French region per family, per function and per pesticide so that I can evaluate the effectiveness of the policies implemented and then compare their results between regions.
-
User story 2: As a member of the APPCB, I want to identify, for a given year, the water treatment plants that have had at least one non-compliant sample so that I can evaluate the effectiveness of the policies implemented and then compare their results between regions.
Here is the final result required at the end of this activity:
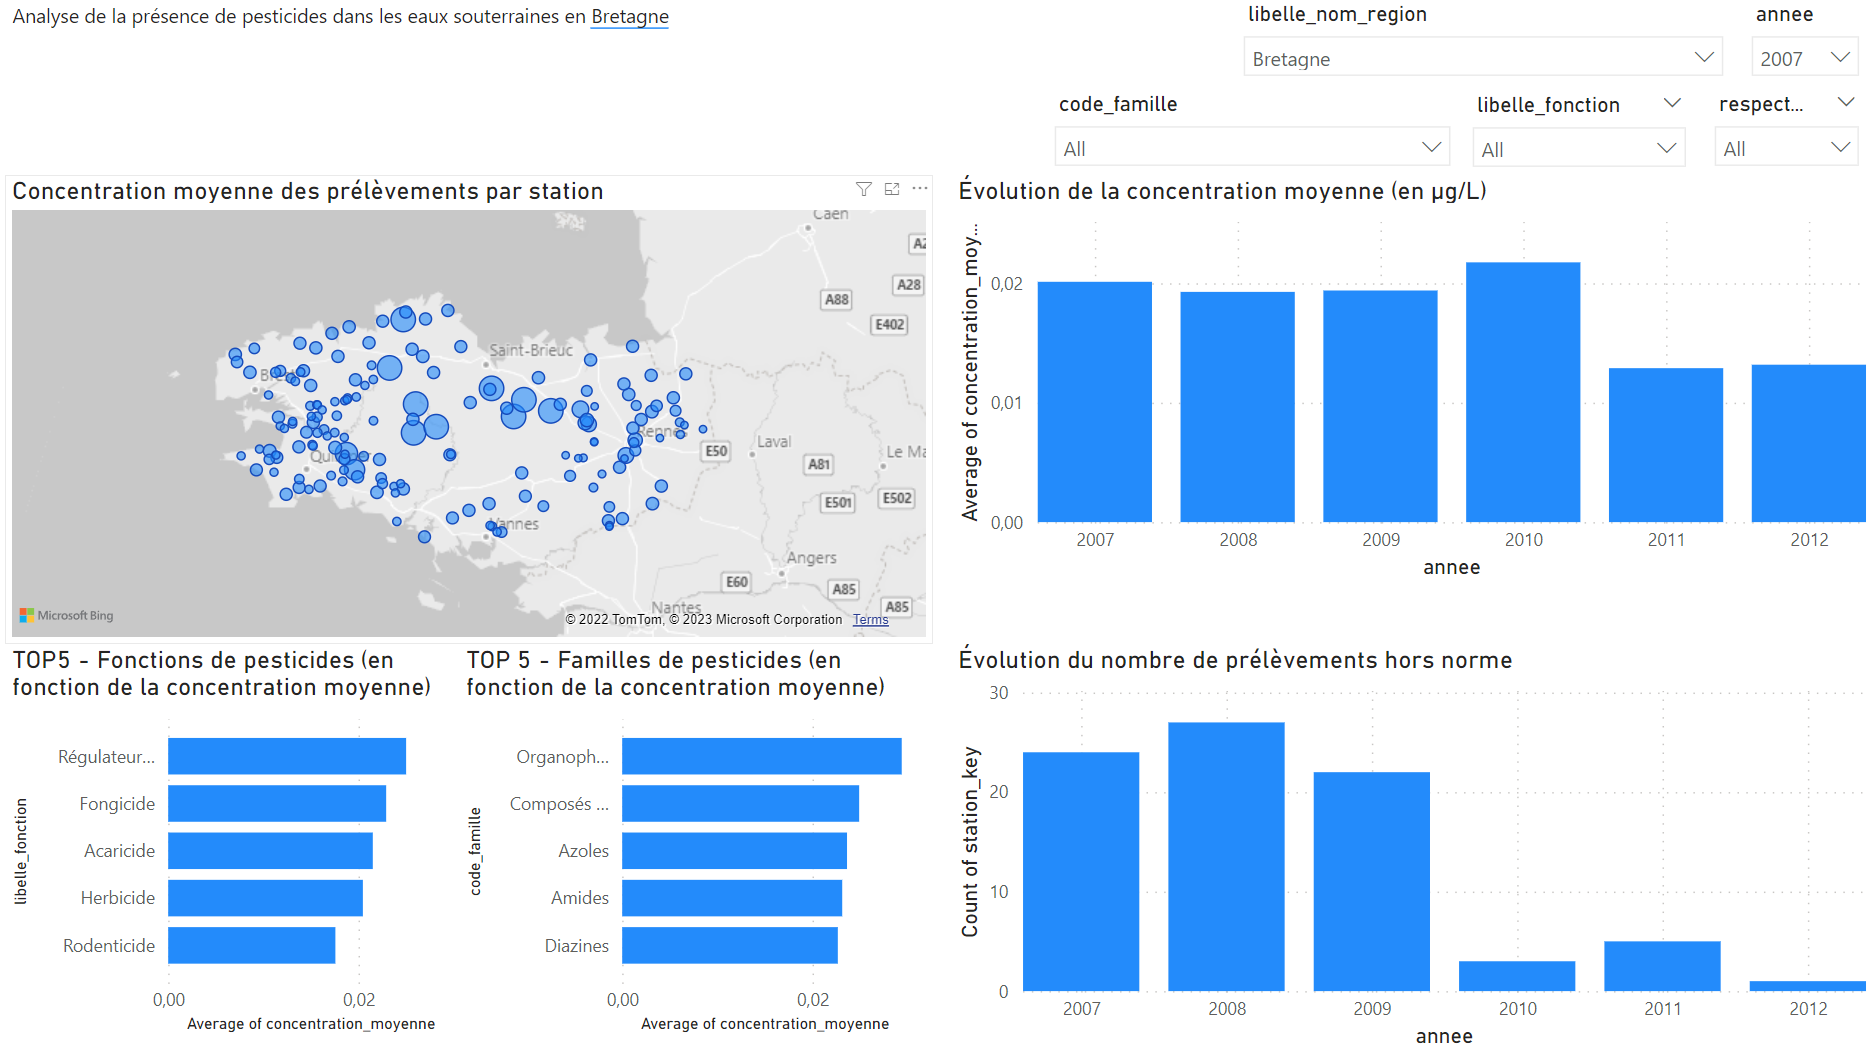
Creating the regional dashboard
The aim of this second dashboard is to give users a more precise view of the situation in their region in order to identify the type of pollution, its location and the practices at their origin over time. We will therefore be addressing the following three user stories:
-
User story 3: As a member of the APPCB, I want to see, for a given year in my region, the pesticide levels per family and per function for each of the water treatment plants in order to identify the local practices that need to be addressed.
-
User story 4: As a member of the APPCB, I need to identify, for a given year in my region, the water treatment plants that have had at least one non-compliant sample so that I can quickly identify the sites on which priority measures need to be implemented.
-
User story 5: As a member of the APPCB, I want to observe, in my region, the yearly changes in average pesticide concentrations and in the number of non-compliant samples per pesticide family and function in order to determine the degree of urgency (occasional or recurrent situation) and the type of actions (emergency or substantive responses) to be carried out.
Here is the final result required at the end of this activity:
Publication
We will now publish your work and post it online. To publish your data online, you must link Power BI to your IMT Atlantique account. However, your license level does not enable you to engage in private sharing. You will therefore create an open publication on the Web.
Creating your Microsoft Azure account
To create your account, you must follow the process described on this page of the intranet.
This process must have been completed at least 24 hours previously. If this is not the case, you will be unable to move on to the next stages.
Authentication
Log into Power BI:
- In the top right-hand corner of your screen, click
Sign in. - Enter your IMT Atlantique e-mail address ending in
@imt-atlantique.net. - Use your Microsoft password linked to your IMT Atlantique account.
Open publication
In the File menu, select Publish > Publish to Power BI and then choose My workspace.
Wait until the end of the process and click Open AtelierPowerBI.pbix. You now have access to a web environment containing your dashboards.
In order to share your work with an external user (who may not have access to Power BI), we shall configure an open publication that anyone can access (the only option possible with the IMT Atlantique license). To do this:
- In the
Fichier(File) menu, selectIncorporer le rapport(Integrate the report) >Publier sur le web (public)(Publish on the Web (public). - Then select
Créer un code incorporé(Create an integrated code) >Publier(Publish). - You can now share the given link or configure your report for an HTML publication.
If an error message appears, stating that you must ask an administrator for permission to publish, close the message, wait a few moments and try again.