Dimensional schema
In this second section on ETL processes, we will be focusing on the complete version of the dimensional schema studied in the Dimensional modeling - Part 2 activity, which therefore takes into account the fact that each pesticide is associated with several functions.
The dimensional schema to be produced is presented in the figure below. It describes the fact-table-based structure and dimensions that your ETL processes must create.
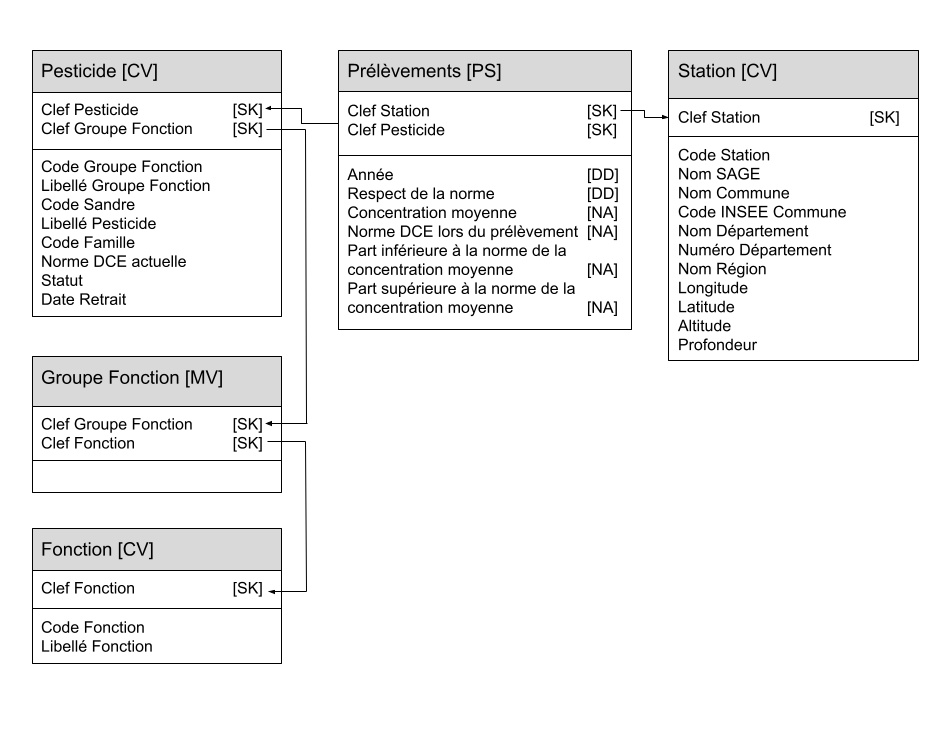
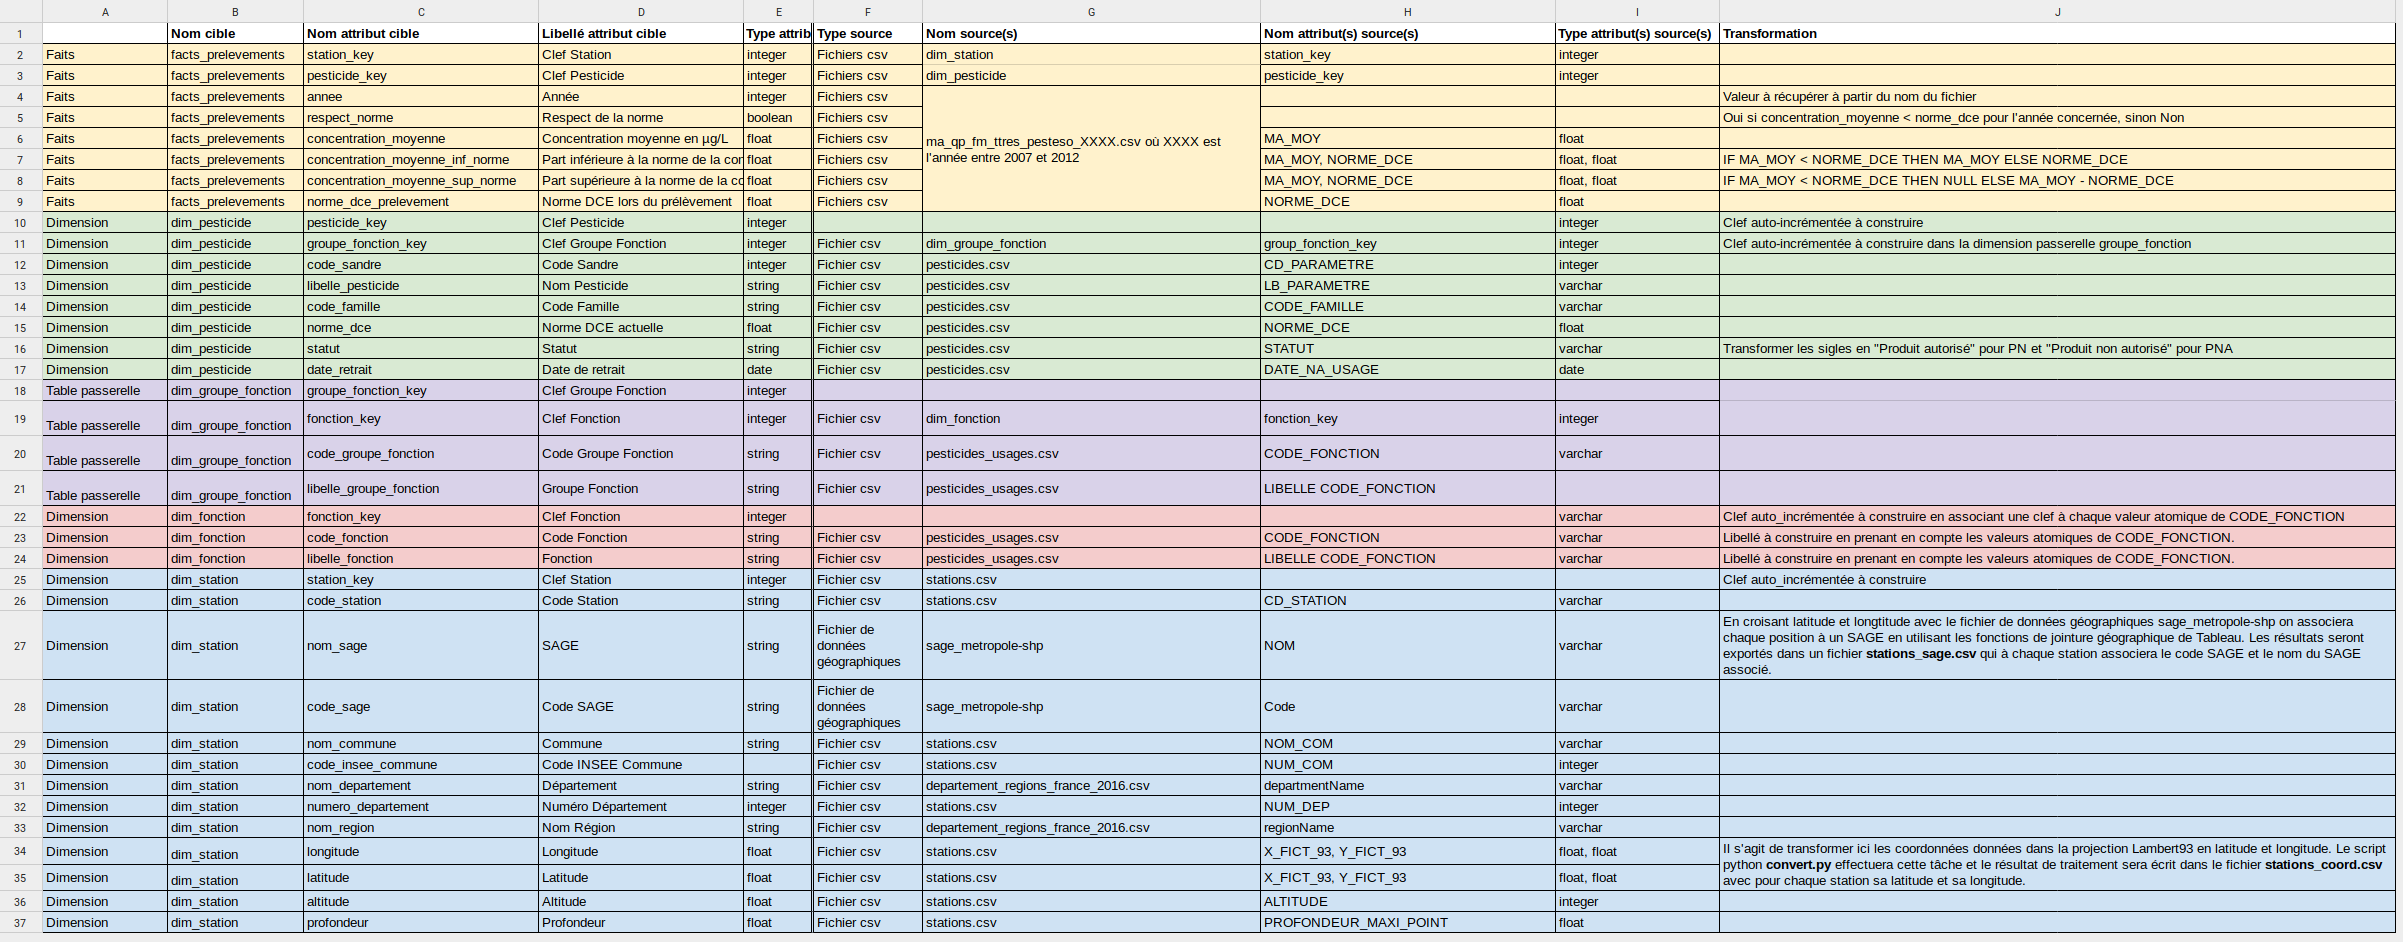
Logical datamap
The logical datamap presented above builds on the logical datamap presented in the first part. Here are the main changes:
- Addition of the
Groupe Fonction(Function Group) bridge table. - Addition of a key to the
Pesticidesdimension. - Addition of the
Fonction(Function) dimension.
Data
Creating the ETL process to improve pesticide management
We will now update our processes to take account of functions associated with pesticides.
Consult the Getting started section in the first part for information about installation and a presentation on the working environment.
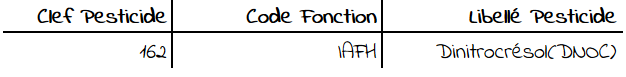
Reminder of the context
Examining an extract from the current pesticide dimension (image below) reveals a problem with the description of a pesticide function. Take the example of Dinitrocrésol; this pesticide is used for its insecticide, acaricide, fungicide and herbicide functions, as shown by its acronym IAFH. This is unsatisfactory, because we need to be able to filter our data for insecticides only, for example.
Because a pesticide can have several functions, one solution would be to add as many Boolean attributes as the number of functions possible within the dimension. We will not be adopting this solution because it lacks genericity (if we want to add new functions) and complicates the use of our dashboards (with some fifteen Boolean variables rather than a single one indicating the function). The way to manage this “several to several” type of cardinality (a pesticide has several functions and one function concerns several pesticides) is to use a data template known as a “bridge table”. The Groupe Fonction dimensional table is therefore a bridge table in the dimensional schema for our data.
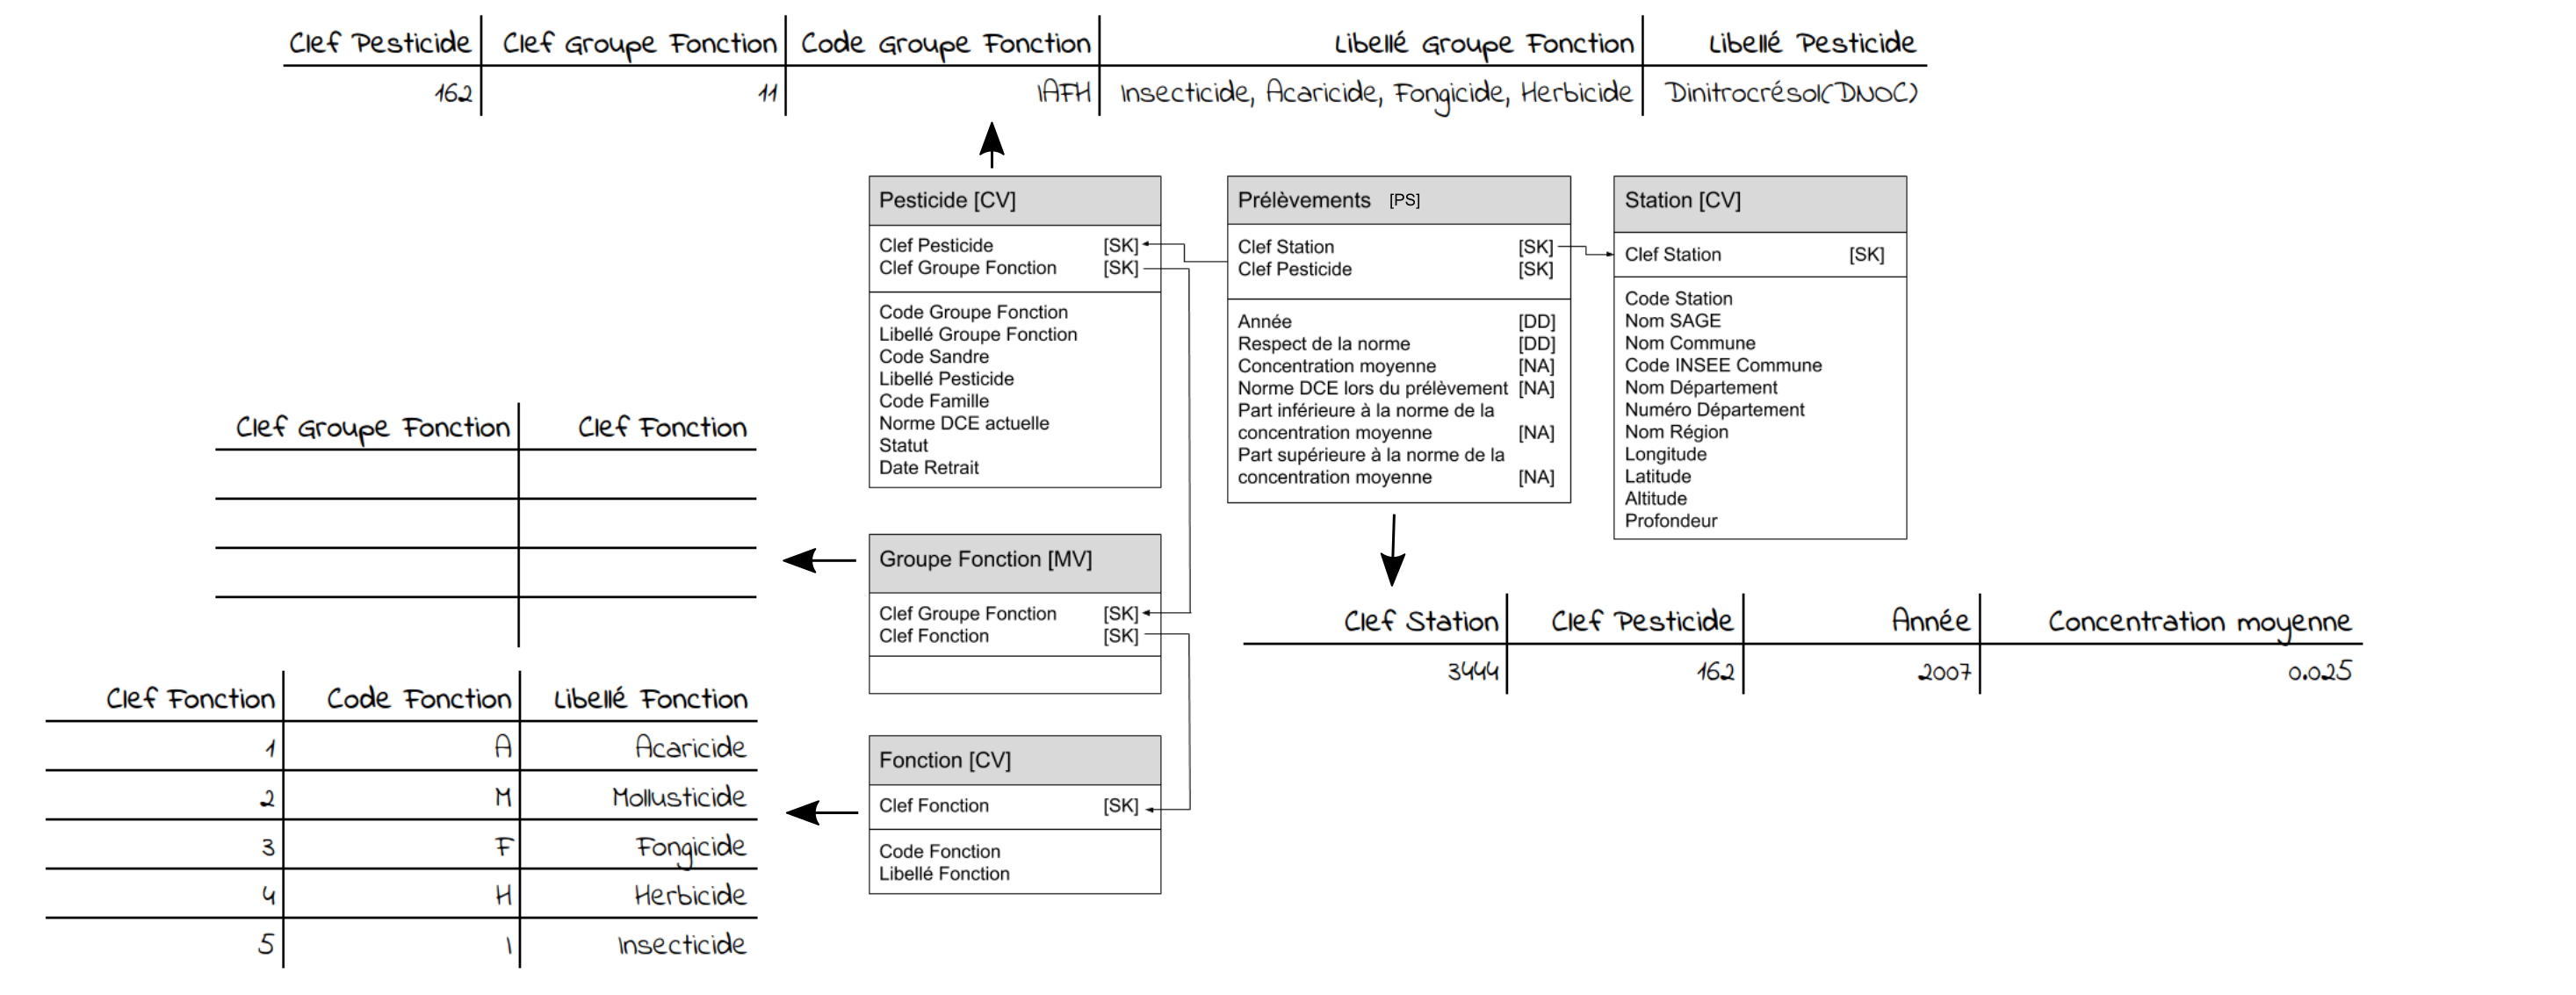
The schema above now shows that:
- a pesticide has a single group of functions (the pesticide
Dinitrocrésolbelongs to group11) - a group of functions concerns several functions (group
11has 4 different functions)
Therefore:
- certain rows of pesticides are associated with several rows of the
Groupe Fonctionbridge table - each row of the
Groupe Fonctionbridge table is attached to a single function.
Process to be implemented
We will be implementing the bridge table mechanism on a step-by-step basis. Please note! You must create a new Easymorph project for each of these pages: