- Giving you an overview of the project to be carried out during the course.
-Presenting the stages required to create a prototype dashboard based on a relatively vague expression of needs.
- Raising awareness of the competencies to be developed.
“Decision-Support and Management” case study
The CEO of Quiventou believes that it is essential to develop the home delivery offering.
Observation: Successive lockdown situations have given the company’s clientele a taste for this type of service, and especially for fresh organic products.
Target: The retail chain’s target is a five-fold increase in the number of its customers ordering home deliveries of fresh organic products at least once a month.
Strategies:
- During marketing campaigns, improve the targeting of customers who are likely to be interested
- Increase the range of fresh organic products that can be delivered throughout the area served by each store
- Increase customer satisfaction concerning the quality of the delivery service
Work to be carried out
Initially working alone, you will need to write a story corresponding to one of the three strategies. Secondly, working in a group, you will need to discuss and improve your stories before finally selecting two of them.
If necessary, make assumptions about the how the chain store operates or the nature of its needs.
Stages of work
- Read the page Write a user story.
- Group work: Propose two stories to respond to the problem described above. Download and rename the grid Groupe_X_GrilleRecits.xlsx (
Xbeing the number of your group), then :- Complete the
Identificationtab - Place each of your two stories in the
Evaluation Récit 1(Story 1 Evaluation) andEvaluation Récit 2(Story 2 Evaluation) tabs. - Write your stories on the board to present them.
- Email your file to the assessors who will come to listen to you.
- Complete the
- Two members of your group will swap places with members of the twinned group (1-2, 3-4, 5-6, 7-8) :
- The two members who have left their groups (the assessors) must evaluate both stories of the group they are visiting using the assessment grid for the visited group. During the evaluation, the members of the evaluated group must defend their proposed stories. The assessors must:
- update the
Identificationtab with their group number and their name, - complete the
Evaluation Récit 1andEvaluation Récit 2tabs, - return the completed file by e-mail.
- update the
- The two members who have left their groups (the assessors) must evaluate both stories of the group they are visiting using the assessment grid for the visited group. During the evaluation, the members of the evaluated group must defend their proposed stories. The assessors must:
- Return to your group :
- Read the evaluations carried out by your assessors
- Upload the assessment file to Moodle (one group member only).
- Full class debrief :
- Log into Wooclap [KKBAYR] (https://app.wooclap.com/KKBAYR?from=event-page) by authenticating with your IMT Atlantic account via SSO.
Discovery of projects
This activity aims to prepare the ground for the project that you will carry out in this teaching. You will have to read the subject of each of the projects and establish a summary sheet for each of them. This summary sheet must bring together information to identify the project stakeholders, their objectives, the functional needs of users and the available data.
Work to be done
- Learn about the Business Understanding phase of a BI project: Phases of a Business Intelligence project.
- Take a look at one of the 2 subjects: Monitoring the workload of teachers and Managing the deployment of teleradiology.
- Write one or 2 slides to summarise the subject of the project you have read about. These slides should contain the following information:
- The context.
- The description of the stakeholders (note that not all stakeholders will be users of the dashboards).
- The objectives of each stakeholder.
- The business processes producing the data.
- Prepare yourself to present your summary sheet in 3 minutes.
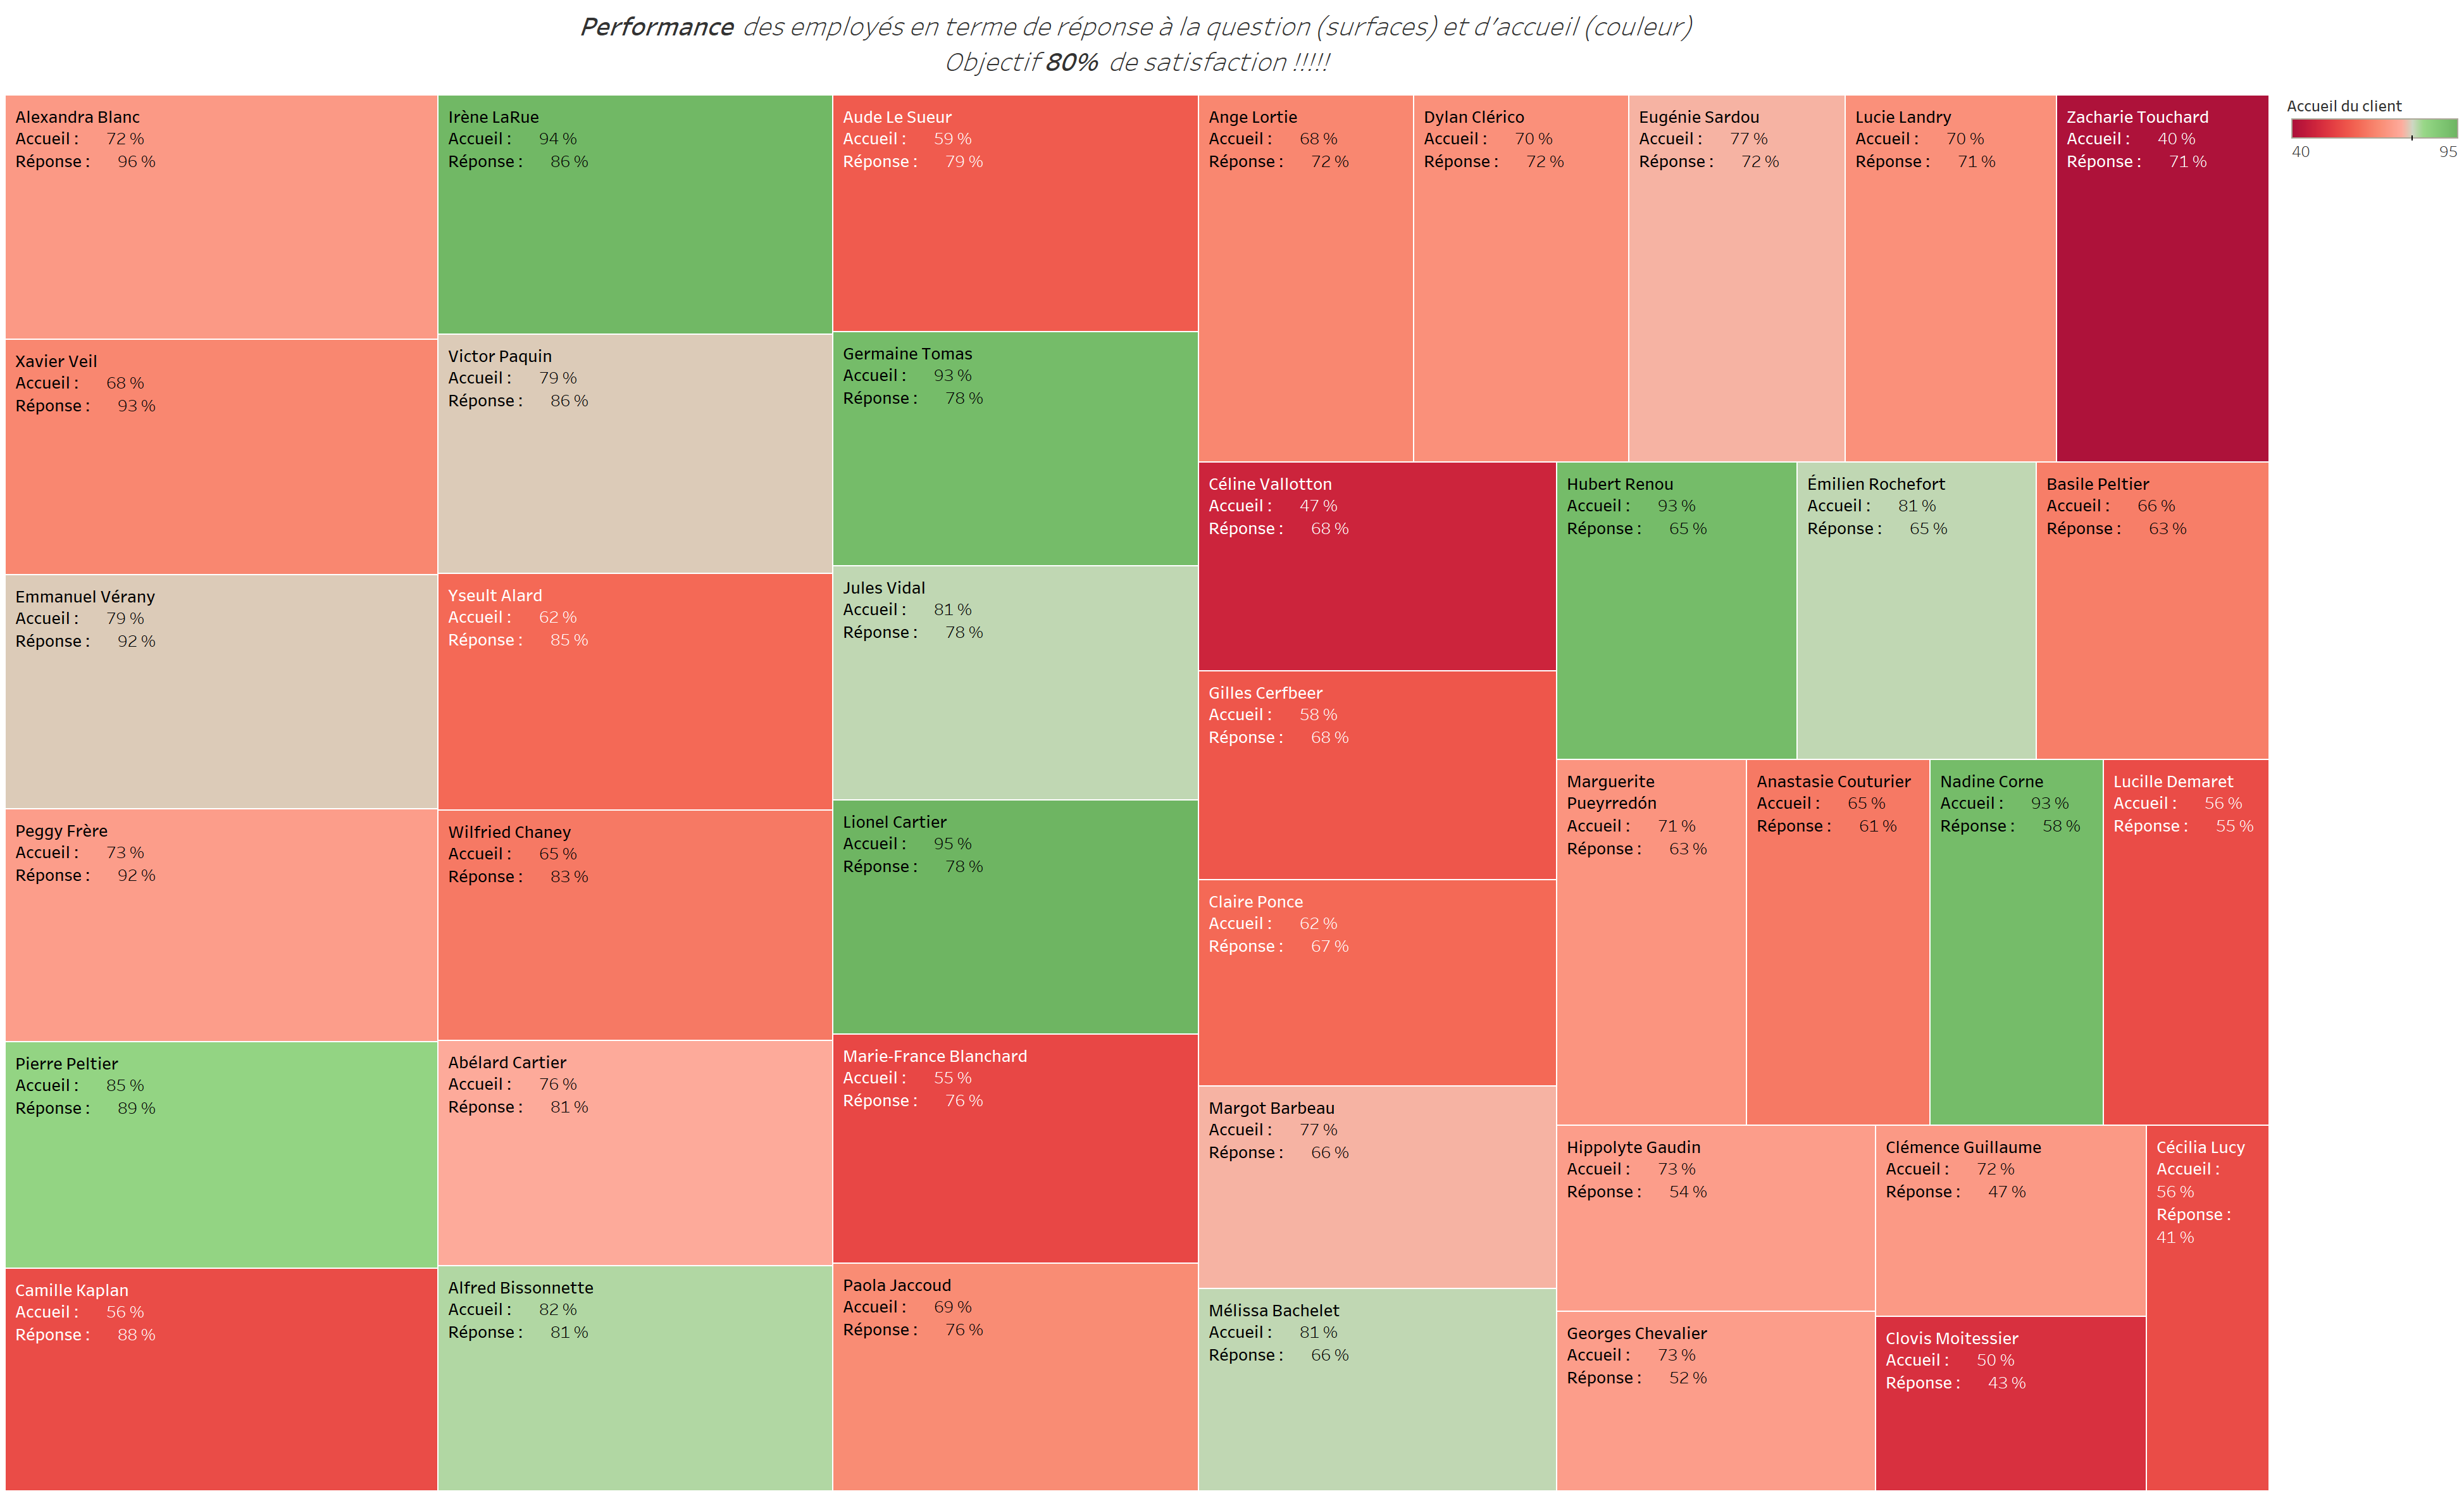
**I want** to measure the quality of customer relations for each telephone sales adviser by taking account of the quality of the overall customer service and quality of the response proposed
**so that** I can provide appropriate training courses for our telephone sales advisers. ### Work to be carried out The following proposal has been made to you and you have decided to completely rework it as it does not meet your quality criteria. You are free to choose a representation in the form of one or more visuals presented side by side, and must provide a short text explaining how to use your solution (specifying any interactive elements that may be included).