Activity(ies):
- Dimensional modeling - Part 1
Concept(s) to be familiar with:
- Dimensional modeling: Fundamental concepts
Introduction
Preamble
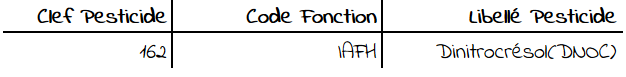
In this second part, we will be focusing on functions associated with pesticides. Examining extract from the pesticide dimension presented in Part 1 (image below), reveals a problem regarding the description of a pesticide function. Take Dinitrocrésol, for example; this pesticide is used for its insecticide, acaricide, fungicide and herbicide functions, as shown by its acronym IAFH. This data structure is unsatisfactory because we need to be able to simply filter our data for insecticides, for example, (without having to process the string IAFH).
Dimensional schema
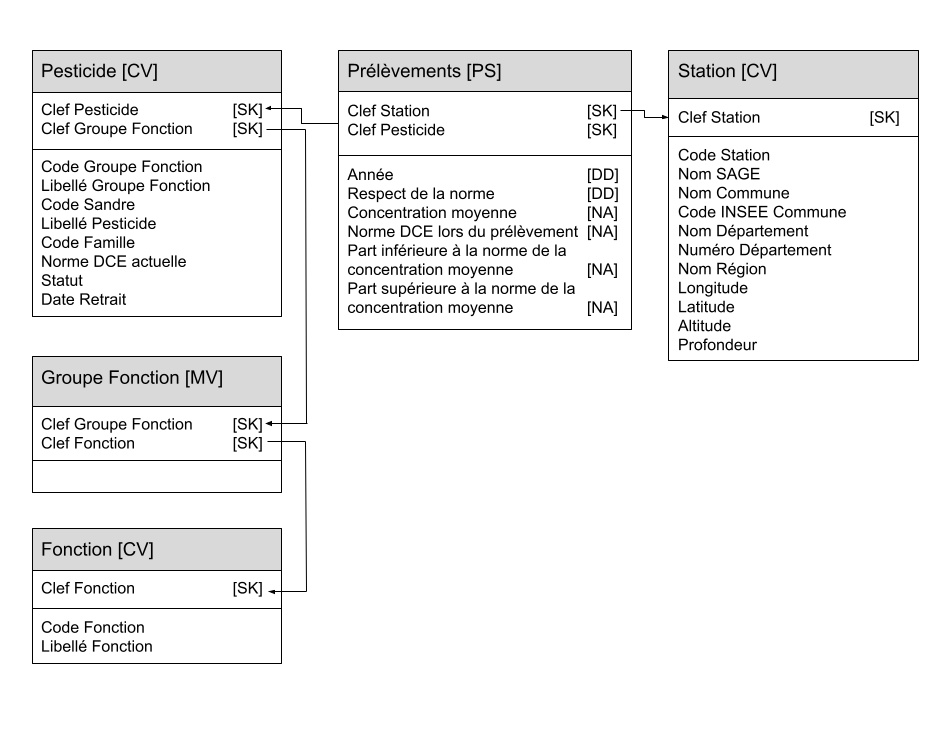
In this activity, we will be working on a final version of the dimensional schema. In relation to the schema seen in Part 1, this one includes annotations, degenerate dimensions and a bridge table.
Annotations
The annotations included in this schema conform to the best practices presented in Agile Data Warehouse Design: Collaborative Dimensional Modeling, from Whiteboard to Star Schema. Laurence Corr and Jim Stagnitto. DecisionOne Press, 2011 (see Appendix B). You will find many dimensional schemas without these annotations, but we advise you to take the time to add them in order to facilitate their interpretation by the experts.
Rather than describing all these annotations here, we will simply provide the following information in order to clarify them:
- The fact table is annotated
PSforPeriodic Snapshotfact table. This means that each row of the table characterizes a periodic event in time. There are other types of fact tables, as you will see on the pages on types of fact tables and factless fact table. If all pesticide samples (rather than only the annual averages) were entered in a fact table, this would be a transaction fact table with the annotationTFforTransaction Fact Table. This means that each row of the table characterizes a discreet event in time. - The dimensions are annotated. In this case,
CVforCurrent valueis a specific procedure concerning the changes in dimensions. For further information, read the page on slowly changing dimensions and mini-dimensions. As for the notationMV, standing forMulti-valued, this indicates the presence of a multi-valued bridge table used to manage a several-to-several relationship between attributes. We shall return to this below. - The measures in the fact table are annotated. Here,
NAmeans that the measures are non-additive. Other acronyms also exist:FAforFull AdditiveandSAforSemi-Additive. For further information, read the page on additivity properties.
Degenerate dimensions
When a dimension has no attributes, we can delete the dimension table and replace it with an attribute in the fact table. To learn more about degenerate dimensions, read this page.
Here, in relation to the initial schema, we have therefore deleted the Année (Year) dimension table, which contained nothing but the year. In addition, a relevant item of information that was missing from the previous version was whether or not a pesticide concentration exceeded the level specified by the standard. This information can be accessed by performing a comparison with the value of the standard, but to facilitate the filters, we have decided in this case to create a degenerate dimension with the attribute entitled Respect de la norme (Compliance with the standard).
Bridge table
Because a pesticide can have several functions, one solution would be to add as many Boolean attributes as the number of functions possible within the dimension. We will not be adopting this solution because it lacks genericity (if we want to add new functions) and complicates the use of our dashboards (with some fifteen Boolean variables rather than a single one indicating the function). The way to manage this “several-to-several” type of cardinality (a pesticide has several functions and one function concerns several pesticides) is to use a data template known as a “bridge table”. The Groupe Fonction (Function Group) dimensional table is therefore a bridge table in the dimensional schema for our data.
Facts and dimensions
Granularity
Let’s return to the concept of “grain”, which must be fully understood starting a Business Intelligence project. Here is a reminder of the definition:
- Grain
- The grain defines the level of detail of the information contained in a row of a fact table. It is defined by a minimal set of dimensions.
The grain is therefore defined by a non-empty subset of the dimensions in the fact table. This does not necessarily include all the dimensions. To detect the irrelevant dimensions, simply remove one of them from the grain and ask yourself whether it is still possible to distinguish between two rows in the fact table. If this is not the case, you should keep the dimension.
Note that it is absolutely imperative that all the measures in the fact table share the same grain, without any exceptions. To check this, ask yourself whether a given measure is properly defined according to [insert the list of dimensions here].
The bridge table
By observing the Pesticides dimension, it can be seen that each one has several associated functions which are encoded in a string. Given the inadvisability of storing the list of possible functions in a single attribute (as this would complicate access to the information) we will use a template known as a bridge table.
Reading Bridge table
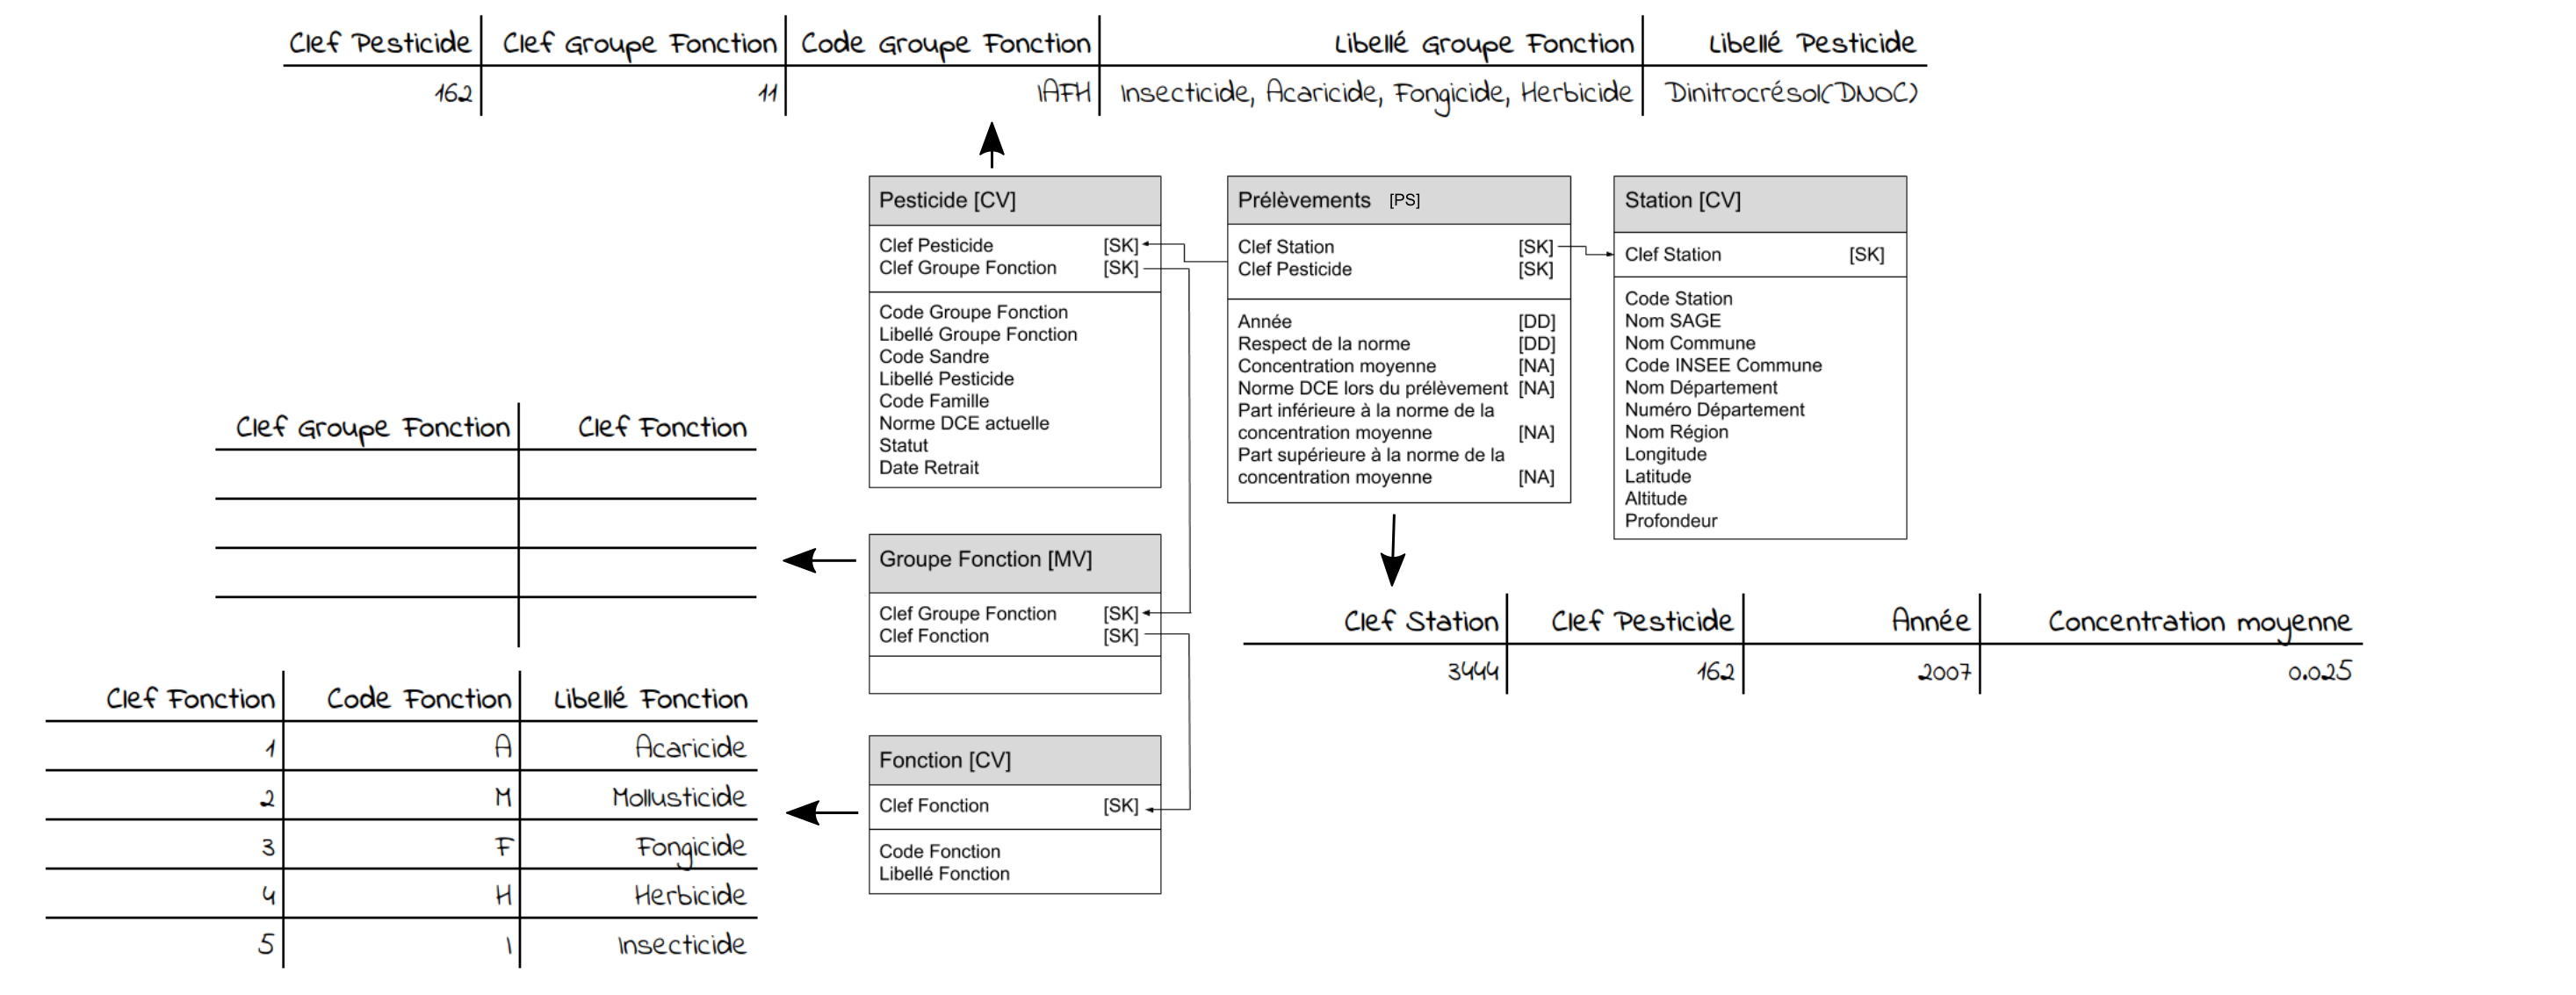
The dimensional schema now reveals that:
- a pesticide has a single function group (the pesticide
Dinitrocrésolbelongs to group11) - one function group concerns several functions (group
11has four different functions)
Consequently:
- certain rows of pesticides are associated with several rows of the
Groupe Fonctionbridge table - each row of the
Groupe Fonctionbridge table is associated with a single function.
The star schema versus the snowflake schema
As a reminder, the concepts of star schema and snowflake schema are archetypes used to distinguish between non-normalized schemas (star schemas) and normalized schemas (snowflake schemas).