Activity(ies) :
- Power BI
Concept(s) to be familiar with:
- Dimensional modeling: Fundamental Concepts
Introduction
Context
Your client is a representative of the Assemblée Permanente des Présidents des Comités de l’eau de Bretagne - permanent assembly of presidents of water boards in Brittany (APPCB) whose remit is to ensure the balanced, collaborative and concerted management of water and aquatic environments in Brittany. It is responsible for:
- Sharing knowledge, tools and information
- Promoting exchanges of experience and the expression of common positions
- Encouraging a territorial organizational system that is relevant to the planning of water management and the increased responsibilities of local water boards (CLEs)
The French Law on Water (Loi sur l’eau) of 1992 triggered the production of water planning and management schemes (Schémas d’Aménagement et de Gestion de l’eau - SAGE) drawn up on the scale of relevant hydrographic areas (river basins). These are the tools of choice for meeting the European requirements for achieving good water status, as defined by the European Water Framework Directive (WFD). For each of these areas, a local water board (Commission Locale de l’Eau - CLE) organizes debates and consultation by bringing together all stakeholders in water issues. The CLE therefore acts as a “local water parliament”, whose main missions are to develop, implement and monitor the progress of work on the SAGE.
Dimensional schema
A dimensional schema is a logical data diagram used to represent data for decision-support purposes. Regardless of the chosen data-storage tool (OLAP data warehouse, in-memory solution, relational database, etc.), dimensional data modeling can be used to structure this data (into measures and data dimensions), while incorporating historization mechanisms.
We will gradually be familiarizing ourselves with the concept of dimensional schemas. The schema below provides a simplified overview of the data used to create dashboards on pesticides.
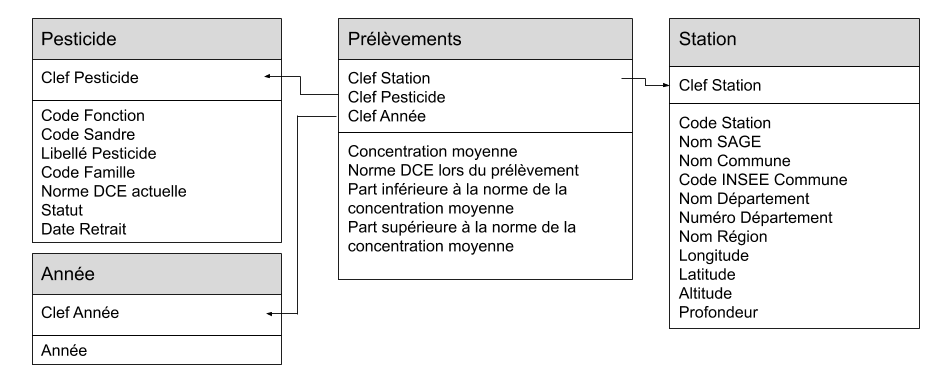
The aim of this activity is to understand what it means and why it has been developed in this way.
The dimensional schema
Dimensional schemas are logical diagrams of data used to represent decision-making data. The specificity of decision-support data is that it is systematically historized and the queries likely to be submitted in relation to it are complex aggregates. Unlike operational systems, this data can be periodically refreshed in order to update it without problems related to competition. Before examining two key concepts: the star schema and the bus architecture, let’s present a few definitions.
Definitions
When we want to monitor the performance of a business process or an activity, we use dashboards featuring one or more indicators. An indicator is a graphical representation of one or more measures, according to one or more data dimensions. In a dimensional model, these measures are called “facts” and the data dimensions which enable the definition of the context are called “dimensions”.
- Fact / Measure
- A fact or measure corresponds to a value in a row of a fact table.
- Dimension
- A dimension is a data dimension in which a measure can be considered. Dimensions enable navigation within the levels of granularity.
- Grain
- The grain defines the level of detail of the information contained in a row of a fact table. It is defined by a minimal set of dimensions.
Reading Granularity
The star schema versus the snowflake schema
The concepts of star schema and snowflake schema are archetypes used to distinguish between non-normalized schemas (star schemas) and normalized schemas (snowflake schemas).
In a dimensional schema, a fact table is linked to dimensions in order to create a datamart, i.e. an information market. Two approaches can therefore be used to link facts and dimensions: the star schema and the snowflake schema.
- Star schema
- A “star” schema is created when a central fact table containing measures is linked to dimensions that are not interlinked. This means that we are dealing with a non-normalized schema.
A star schema introduces redundancy in a controlled manner at the dimensional level in order to improve the performance of complex queries by avoiding multiple joins between the dimensions.
Reading Star schema
- Snowflake schema
- A “snowflake” schema is said to exist when a central fact table is linked to dimensions which are themselves linked to new dimensions created by normalizing the information.
A snowflake schema avoids the introduction of redundancy by normalizing the dimensions. Given that we are operating in an OLAP paradigm (without the notion of transaction), this approach is only useful in certain specific contexts. Outside these situations, which you will discover later, star schemas are always preferred.
Reading Snowflake schema
Dimensional keys
When creating a dimension, the choice of the dimensional key is highly important. The recommendation is to avoid using natural keys and instead opt for artificial keys in order to provide insulation from the source operational system.
- Artificial key
- An artificial key is an integer that is sequentially assigned when a dimension is populated.
Reading The different types of keys
Bus architecture
Kimball advocates an iterative approach when carrying out a decision-support project, in which each step consists in designing a datamart (defined by a star schema) that meets the needs of a business process or a decision-making activity. During the different iterations of the project, a new datamart is produced by creating a new fact table that is based, as far as possible, on pre-existing dimensions. Two dimensions are said to be conformed when they comply with the following definition:
- Conformed dimensions
- Two conformed dimensions are either identical, or one of them is a subset of the more detailed dimension.
Conformed dimensions use the same dimensional keys, the same attribute column names, the same attribute definitions and the same attribute values (which guarantees the consistency of data in the analysis of different business processes).
Reading Conformed dimensions
This approach leads to the implementation of a bus architecture based on conformed dimensions and facts (we shall discover the concept of conformed facts in the second part). In this way, the principle of decision-support bus architecture (advocated by Kimball) stipulates that a set of datamarts share several common dimensions known as conformed dimensions.
Reading Architecture of decision-support systems: Kimball versus Inmon
Reading Bus architecture
A bus matrix can provide an overview of a decision-support system. For each process (in rows), the bus matrix links the different dimensions that are used (in columns).