Context
Factless fact tables are very useful in two different types of situations:
- modeling events which are not measured by facts: we are only interested in the existence of the event (e.g. enrollment on a course or for a conference).
- modeling information when we are interested in establishing links between different dimensions (e.g. assigning an advisor to a client, eligibility for access to an offering/product).
In such situations, we therefore create a factless fact table whose sole attributes are dimension keys or degenerate dimensions. No facts are therefore attached to this table.
Reading Factless fact table: Star Schema. Christopher Adamson. pages 291-300
Reading Factless fact table: Agile Data Warehouse Design: Collaborative Dimensional Modeling, from Whiteboard to Star Schema Laurence Corr, and Jim Stagnitto. pages 248-249
Modeling factless events
This first situation concerns processes for which the sole measure of interest to us is the number of events that have occurred. These processes can be modeled by a factless fact table in which the grain corresponds to an event. No facts are required and the only possible analysis is a count of the number of rows. To this end, a count attribute can sometimes be found in this type of fact table, whose sole possible value is 1.
This type of factless fact table may be required in numerous situations:
- for counting documents: number of contracts entered into, number of applications, etc.
- for monitoring the activity of a department: number of customer contacts, number of tickets opened/closed, etc.
- for monitoring campaigns: number of advertisements disseminated, number of emails opened, number of views
- for monitoring visitor numbers: number of pages viewed, number of clicks
- for monitoring enrollments: number of students enrolled, present or absent
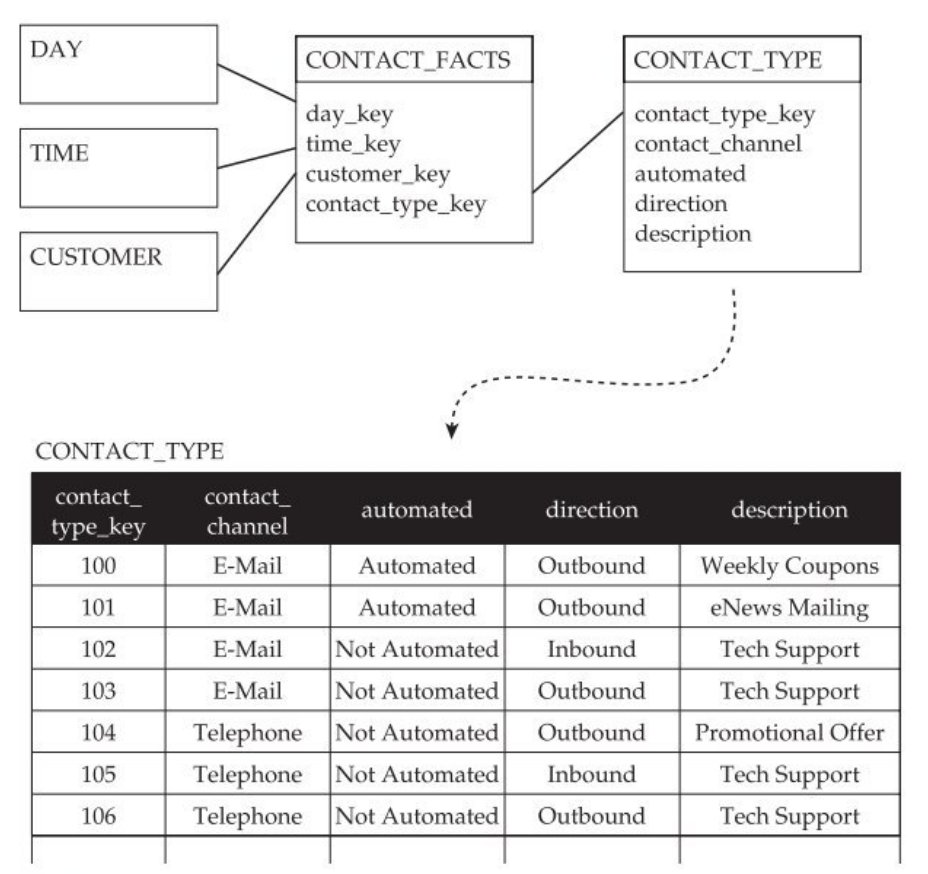
Let’s take the example of a company that needs to coordinate its customer relationship management strategy and wants to monitor contacts with customers. The relevant information items required for the creation of indicators are the contact date/time, the customer concerned and the manner in which the contact was initiated. A contact can be described by the means used (email, telephone, letter), the direction of the contact (initiated by the company or by the customer), whether or not it was automated, and its context (advertising campaign, technical support, newsletter, etc.). All of these information items are therefore data dimensions: the only aspect of interest to us is the ability to submit queries in order to determine how many of these situations have occurred according to the chosen criteria.
The following figure illustrates a solution consisting of a star schema with a central factless fact table CONTACT_FACTS and the different dimensions: DAY, TIME, CUSTOMER and CONTACT_TYPE, which will enable us to configure the counts.
Modeling information that is not directly linked to a business process
It is sometimes necessary to monitor information that is not directly linked to a business process. For example, there may be a need to represent the conditions, coverage or eligibility, such as:
- the salespersons associated with a client
- students’ access to software solutions or offerings
- alert-activation conditions
- ongoing campaigns at a given moment
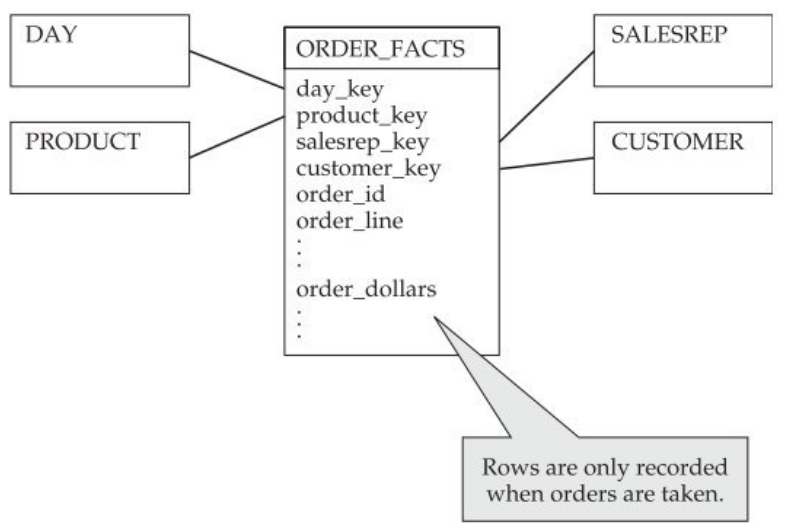
Let’s take the textbook example of a product order. The dimensional schema below models the orders placed ORDER_FACTS for a PRODUCT, by a CUSTOMER, via a SALESREP on a given DAY in the context of an order ORDER_ID. Here, the ORDER_FACTS table is a transaction fact table measuring the value of the order order_dollars, but its cost, or the number of products, etc., could also be envisaged. The grain of this table is PRODUCT, ORDER_ID because each row corresponds to the order of a type of product in the context of an order.
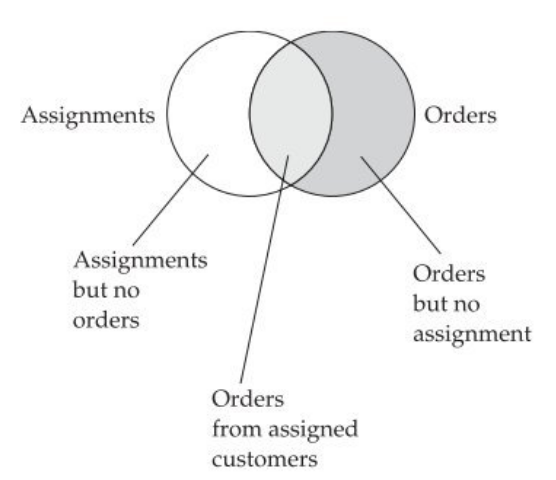
Now let’s consider a situation in which the company assigns a portfolio of prospects or customers to its salespersons, which is a very common occurrence, especially in B2B. The problem arising from modeling in the form of an ORDER_FACTS fact table is that it will be impossible to distinguish between the following situations (see the diagram below):
- customers assigned to a salesperson, who have not ordered (no observation is possible in the fact table).
- customers who have placed an order and were assigned to a salesperson.
- customers who have placed an order without being assigned to a salesperson.
To analyze one of these situations in detail, such as orders placed by customers without an assigned salesperson, we shall need this information on assignments. For this purpose, we create a factless fact table entitled CUSTOMER_ASSIGNMENT_FACTS, as shown in the image below.
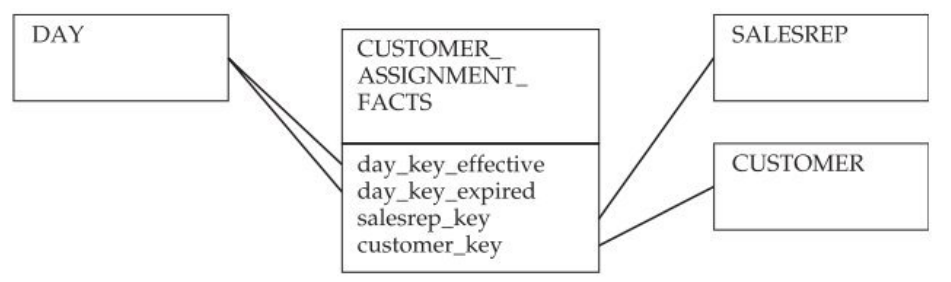
This models the conditions for assigning a salesperson to a customer (in this case, a period with a start date and an expiry date).
It could be argued that this factless fact table is not linked to a business process. The business process could be the assignment of a customer portfolio to each sales person. In itself, this would be unlikely to change the proposed solution.
However, it is important to understand that a factless fact table representing conditions, coverage or eligibility can only usefully provide information for the analysis of a business process. This information is also present in the operational system, but in this case, we require it in the decision-support system to shed light on another process.