Decision-support information systems cover all the resources (human, material and software) used to aggregate, consolidate, historize and present an organization’s data in order to support decision-making.
-
What do we mean by consolidate? This means ensuring the consistency of an organization’s data, which is, by its very nature, heterogeneous and dispersed among different business systems such as the customer relationship management (CRM) system, the human resources (HR) system, the dedicated finance system, etc.
-
What do we mean by ensuring consistency? This is a matter of making sure that there is only a single answer to a given question, such as “What is the gross profit generated by our chain of stores during the Christmas period in the Europe region?”. In this case, we need to provide precise definitions of gross profit, the Christmas period and the scope of the Europe region.
-
What do we mean by historize? This consists in retaining data for long periods with a view to observing how it changes over time. Certain challenges need to be overcome in order to do this, which include deciding how to ensure the consistency of data whose definitions may change over time.
Overview of a decision-support information system
An organization’s decision-support information system is populated with data from its operational information systems, which manage the day-to-day aspects of the company’s business. Data from an operational system, which may originate from different data sources, is shown on the left-hand side of the diagram below. This includes the different ERP (Enterprise Resource Planning) systems, which enable the management of business processes such as CRM (Customer Relationship Management), HR (Human Resources), Finance, etc.
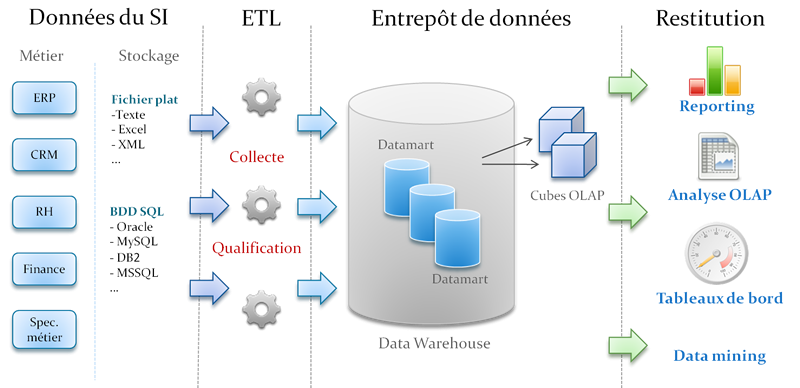
Decision-support information systems are divided into three main zones:
- The ETL (Extract, Transform, Load) zone, in which data processing is carried out: this zone should be reserved for developers. The final user should not, under any circumstances, be able to access it because the data it contains will not necessarily be in a coherent state.
- The data storage area: historically, this has taken the form of a data warehouse based on OLAP technology. We can now also envisage other types of data storage such as in-memory storage or distributed data systems (HDFS, etc.). However, regardless of the chosen storage format or medium, dimensional modeling is an excellent way to structure data in a logical manner and provide access to it.
- The data-access zone, covering all tools used to generate reports or dashboards. This zone can also provide data at the atomic level for machine-learning tasks.
Data warehouses: different architectures
Technical solutions for managing decision-making data belong to the OLAP category of data-processing procedures, which take account of specific needs related to the use of decision-making data: complex queries based on aggregates, few real-time updates, and management of data histories.
Decision-making data is stored in a data warehouse which can be defined in the following manner:
A data warehouse is a database that is specifically structured to enable the storage, indexing and querying of decision-making data.
Kimball and Inmon devised the two main approaches used for structuring data warehouses. These approaches correspond to two different perceptions, either of which may be relevant according to the context. There is therefore no “right” or “wrong” approach, even though Kimball’s method is generally preferred because it is, by nature, more incremental and can simplify the conduct of a decision-support project.
We shall systematically adopt Kimball’s approach during this course.
Kimball’s approach
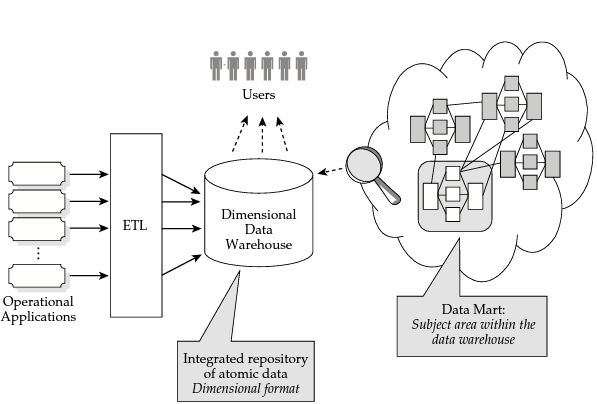
The data warehouse is:
- based on the dimensional modeling of data,
- organized into datamarts, each of which is modeled by a star schema and can be used to analyze a business process,
- incremented by creating a new datamart for each business process to be analyzed (via the bus architecture),
- directly accessed by analytical applications.
Inmon’s approach
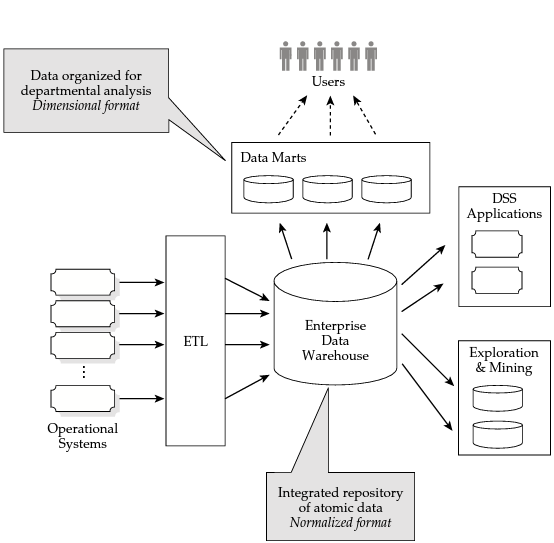
The data warehouse:
- contains all data relating to the different business processes to be analyzed,
- contains data modeled in third normal form,
- cannot be directly accessed by analytical applications.
Datamarts are then created in dimensional format for each process to be analyzed in order to enable access to the data.
Further reading on this topic
Reading Comparison of Bill Inmon and Ralph Kimball paradigm, consulted on 18 October 2019
Reading Data Warehouse Architecture – Kimball and Inmon methodologies, consulted on 18 October 2019
Reading Data Warehouse Design – Inmon versus Kimball, consulted on 18 October 2019